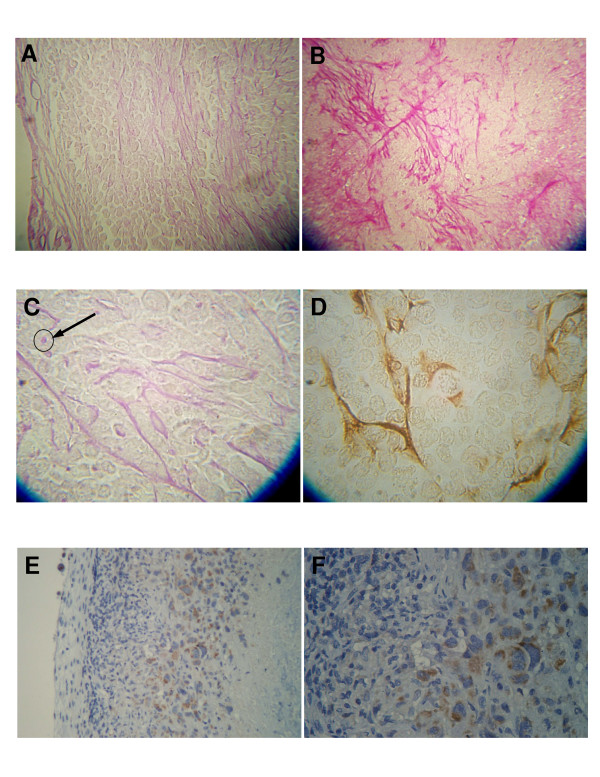
Figure 5.
Photomicrographs illustrating the pattern of the tumor vascular network (A and B), of endothelial pseudopods stained with PAS (C) and with CD-31 specific endothelial markers (D), and of the localization of HIF-α (E and F). A, The tumor capsule (left) reveals blood vessels. The cortex under the capsule reveals no blood vessels and few endothelial pseudopods while the subcortical area to the right has more pseudopods. B, The subcortical area of the tumor reveals a small blood capillary with multiple endothelial pseudopods protruding at right angles into the tumor mass. C, At high magnification endothelial pseudopods are seen to branch and occasionally have a vacuole/lumen (arrow). D, The endothelial pseudopods react positively to the CD-31 specific endothelial marker. The CD-31 antibody identifies endothelial cells using the avidin-biotin peroxidase complex method. E, Viable cell area can be seen beneath tumor capsule (left). Necrotic area can be seen to the right. F, Enlarged subcortical area from E. In E the hypoxic area between the viable and the necrotic tissue is stained brown.

