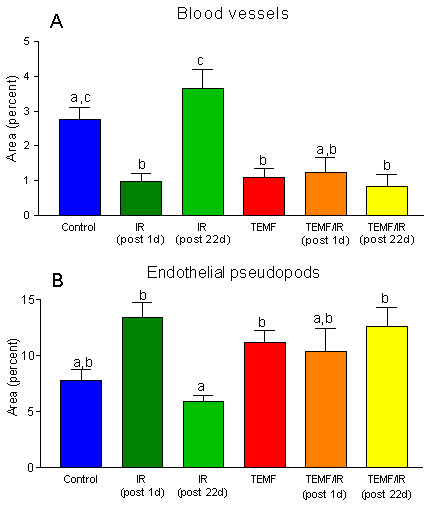
Figure 6.

Quantification of changes in tumor vascularization between treatment groups. A and B, The percent of areas (volume density) of blood vessels and the percent of area of endothelial pseudopods were determined using an ocular grid intercept counting method. The mean ± SEM of each treatment group is graphed. Columns that do not share a common letter within a graph are significantly different (p < 0.01). The data indicate that gamma irradiation and EMF alone or in combination decreased the total area of blood vessels and increased the total area of pseudopods compared to the control. Data from the untreated mice (Control) and the EMF treated mice (TEMF) were pooled from mice from the early and from the late sacrifice because there was no significant time of sacrifice difference within these groups.
