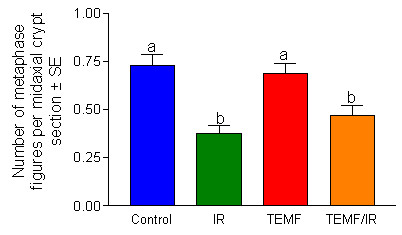
Figure 8.

Number of metaphase figures per midaxial histological section of duodenal crypts. Column height indicates mean ± SEM. The data are from the mice sacrificed one day after the last gamma irradiation exposure. The columns that do not share a common letter are significantly different. Gamma irradiation but not EMF decreased the number of metaphase figures in the duodenal crypts.
