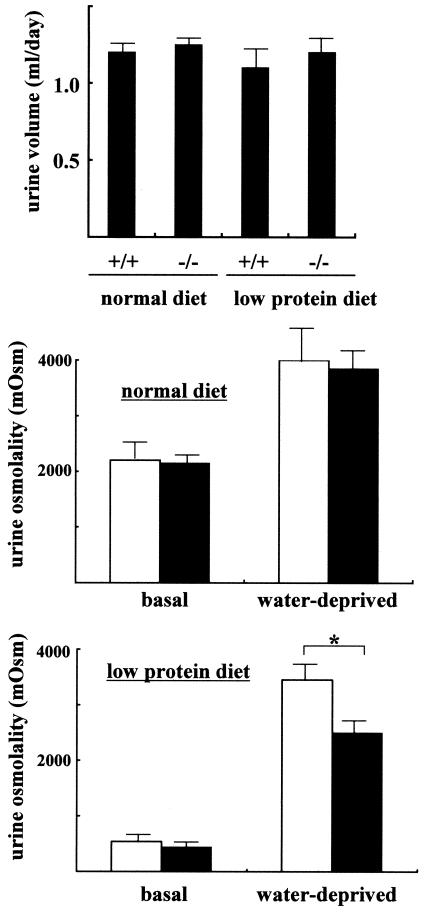
FIG. 5.
Urine concentrating ability of UT-A2−/− mice. Upper panel, daily urine output of mice fed normal (20% protein) and low protein (4%) diets under basal conditions (free access to food and water). Middle and lower panels, urine osmolality of mice fed normal (20% protein) and low protein (4%) diets under basal and dehydrated (36-h period of water deprivation) conditions. *, P < 0.05; n = 5. Filled bars represent −/−, and open bars represent +/+.

