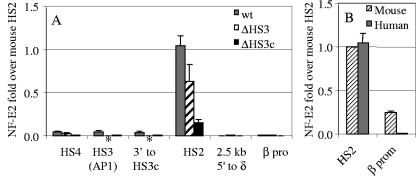
FIG. 5.
NF-E2 recruitment in the LCR and the β gene promoter. (A) NF-E2 recruitment in the LCR region. The measured positions of NF-E2 recruitment are indicated on the x axis. The asterisks on the x axis indicate the deleted sequences in the mutant constructs. The y axis shows increases of NF-E2 compared with that in the mouse HS2 core. Standard variation is shown as small vertical bars at each measurement point. wt, wild type; β pro, β gene promoter. (B) Comparison of NF-E2 recruitment on the human and mouse HS2 cores and between the promoters of the human β gene and of the mouse βmaj gene. β prom, β gene promoter.

