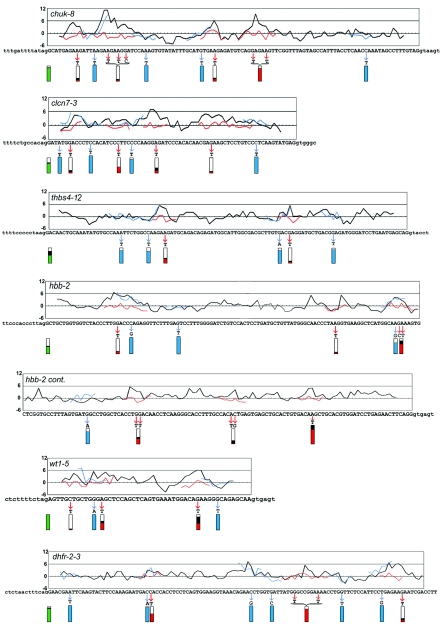
FIG.2.
Characteristics of PESE and control mutants. The black curves in the graphs show the PESE score profile across the exon. Successive windows of 8 nt were scored as described in Zhang and Chasin (51); the average of two scoring systems (P and I) is plotted for simplicity (separate profiles for each scoring system can be seen in Fig. 4). The score for each 8-mer is plotted near the middle of the 8-mer, at position 4. Point mutations in 22 predicted ESE clusters are indicated by the red arrows. The scores for the mutant sequences are shown by the red curves where they differ from the wild type. Twenty-four control mutations were of two types, both indicated by blue arrows and curves: 12 control mutations in PESE clusters were designed to not substantially change the PESE score and 12 control mutations outside PESE or PESS clusters also had little effect on the PESE score. Splicing phenotypes are indicated by the extent of filling of the rectangles below each mutated region. The green rectangles at the left show the extent of splicing (spliced/[spliced + skipped]) for the wild-type exons. The red and blue rectangles show the extent of splicing of the experimental and control mutants, respectively. To point out the effect of mutations on splicing, the colored areas represent the extent of splicing relative to that of the wild type set equal to 1; the black regions above the red or green areas indicate the range of values from two or three replicate transfections. Note that the splicing data presented in Fig. 1 and Table 1 have not been normalized in this way. The last 40 nt of the dhfr-2-3 exon were not mutated and are not shown. cont., continued.

