FIG. 3.
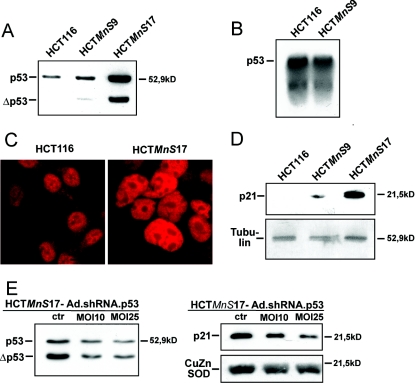
(A) Comparison of the expression level of p53 in the HCT116 cell line versus the MnSOD-overexpressing cell lines HCTMnS9 and HCTMnS17 by Western blot analysis. (B) Analysis of mRNA levels of p53 in HCT116 and HCTMnS9 cells by Northern blotting. (C) Immunofluorescence analysis of the subcellular localization of p53 in HCT116 and HCTMnS17 cells. Bars, 200 μM. (D) Analysis of expression levels of the p53 target gene p21. The expression level of p21 in HCT116 cells was compared to those in the MnSOD-overexpressing cell lines HCTMnS9 and HCTMnS17 by Western blotting. Western blot analysis of tubulin indicates that equal amounts of protein were loaded for immunodetection in panels A and D. (E) An adenovirally expressed shRNA directed at p53 (Ad.shRNA.p53) can shift the amount of the tumor suppressor protein p53 in HCTMnS17 cells back to normal. An adenovirus vector (MOI, 25) expressing a shRNA targeting the jellyfish protein EGFP (Ad.shRNA.EGFP) was used as a control (ctr). Compared to this control, infection at an MOI of 25 reduces the level of p53 back to normal (left) and, in addition, reduces the amount of the transcriptional target p21 (right). The amounts of protein loaded were identical, as indicated by the control Western blot (CuZnSOD).

