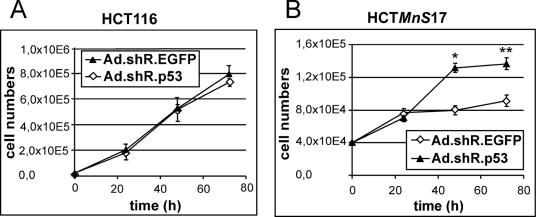
FIG. 5.
Growth curves of HCT116 (A) and the MnSOD-overexpressing cell line HCTMnS17 (B) infected at an MOI of 25 with Ad.shRNA.p53 or the control vector Ad.shRNA.EGFP. Results are depicted as means; error bars, standard errors. The significance of the growth-stimulatory effect of p53 knockdown in HCTMnS17 cells was verified by t test analysis. *, P < 0.05; **, P < 0.001.

