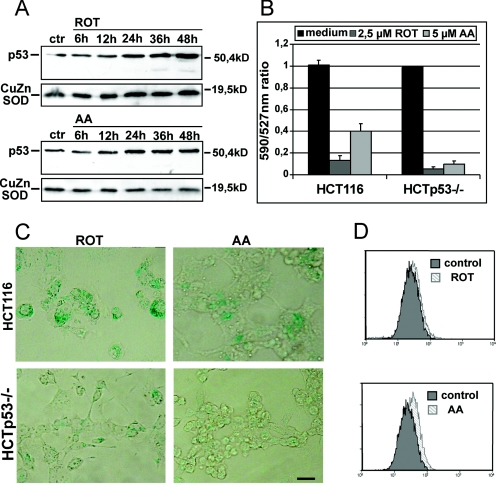
FIG. 7.
(A) Time course of p53 expression levels of HCT116 cells treated with the ETS inhibitor ROT or AA. HCT116 cells were treated for the indicated times with 2.5 μM ROT or 5 μM AA and analyzed by Western blotting. As loading controls, Western blots were probed with an antibody against CuZnSOD. (B) 590/527-nm ratios of JC-1 stained HCT116 and HCTp53−/− cells treated with either ROT or AA. Cells were treated with 2.5 μM ROT or 5 μM AA for 30 min in the presence of JC-1. The 590/527-nm ratios of treated cells were compared to that of untreated cells, for which the ratio was set to 1. Results are means from two independent experiments. Error bars, standard errors. (C) SA-β-Gal activities of HCT116 and HCTp53−/− cells treated with ROT or AA. After treatment for 6 days with 2.5 μM ROT or 5 μM AA, cells were fixed and stained for SA-β-Gal activity. Pictures were taken at a magnification of ×200. Bar, 100 μm. (D) Flow cytometric analysis of HCT116 cells stained with DCF-DA. The histograms show overlaps of 2.5 μM ROT- or 5 μM AA-treated cells (light gray) with untreated control cells (dark gray).

