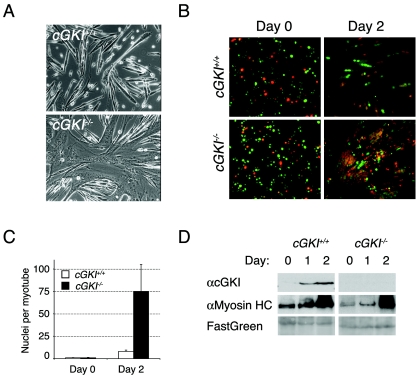
FIG. 9.
cGKI−/− primary myoblasts show an accelerated rate of myoblast fusion upon differentiation. (A) Representative photomicrographs of differentiated (day-2) cGKI+/+ and cGKI−/− primary myoblasts. cGKI−/− myoblasts display excessive fusion compared to control myoblasts and are similar to myoblasts engineered to overexpress dominant-active FoxO1a (5). (B) CellTracker probe analysis shows excessive fusion between red- and green-stained cGKI−/− myoblasts after 2 days of differentiation. (C) The number of nuclei per cell was counted at day 0 and day 2 for cGKI+/+ (white bars) and cGKI−/− (black bars) myoblasts. Means of at least three independent fields are given for each genotype. Error bars show the variance at each data point. (D) Western blot analyses of primary cGKI+/+ and cGKI−/− myoblasts showed that loss of cGKI has no effect on the levels and timing of expression of a late (myosin heavy chain) marker during muscle cell differentiation, nor does it affect expression of FoxO1a. FastGreen-stained sodium dodecyl sulfate-polyacrylamide gel electrophoresis membranes were used as loading and transfer controls.

