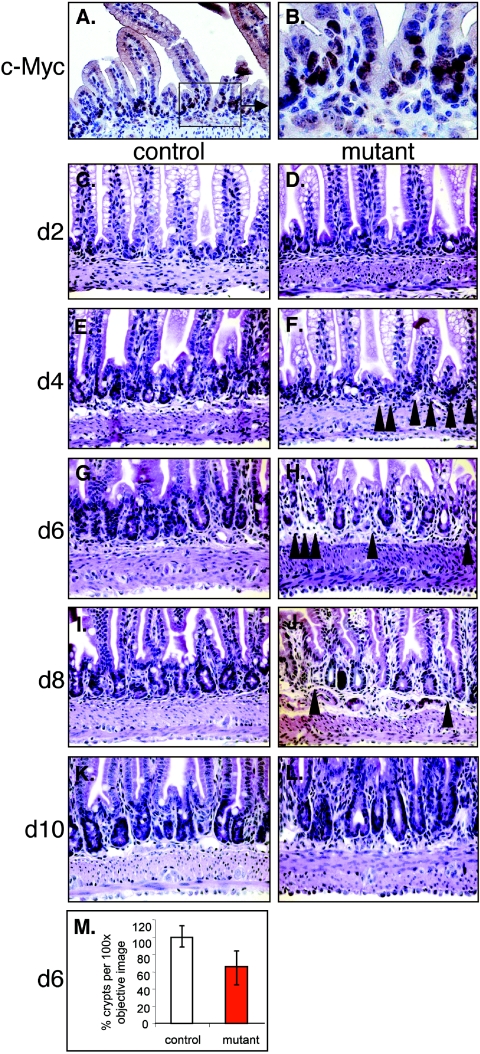
FIG. 4.
Kinetic analysis of the crypt formation process in normal (A, B, C, E, G, I, and K) and mutant (D, F, H, J, and L) mice. (A and B) c-Myc expression in the intervillus region of seven-day-old mice. (C to L) Seven-day-old control or mutant mice were injected with tamoxifen and the duodenum was analyzed by hematoxylin/eosin staining every second day for 10 days. (M) Graphical representation of the percentage of crypts per phase contrast image (100× objective) of tissue sections derived from six different littermates of control (100%) and mutant mice (red bar) 6 days after the first tamoxifen injection. Solid arrows in F, H, and J indicate areas in which crypt formation has not occurred.

