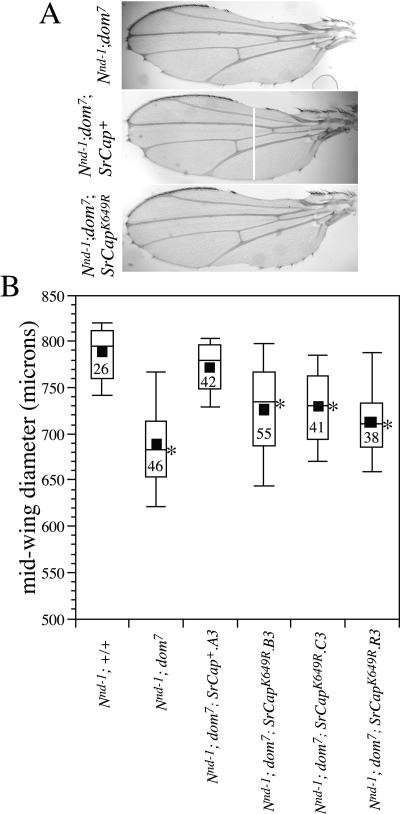
FIG. 5.
SRCAP functionally complements DOM in Notch signaling. (A) Examples of wings showing the extent of wing margin nicking observed in Nnd-1; dom7 flies (top panel), Nnd-1; dom7; SRCAP+ flies (middle panel), and Nnd-1; dom7; SRCAPK649R flies (bottom panel). The bar across the wing in the middle panel indicates the relative position of the midwing measurement line used in panel B (see Materials and Methods). (B) Box plot chart of wing measurements of Nnd-1; dom7, Nnd-1; dom7; SRCAP+, and Nnd-1; dom7; SRCAPK649R flies. The filled squares indicate means, the bars across the open rectangles indicate medians, the tops and bottoms of the open rectangles indicate the 75th- and 25th-percentile values, respectively, and the whiskers indicate the 10th- and 90th-percentile values. Numbers in the boxes indicate the numbers of wings scored. Asterisks indicate genotypes in which the mean difference from Nnd-1; +/+ and from Nnd-1; SRCAP+ is significant at the level of 0.01 by one-way analysis of variance (more statistical details are discussed in Materials and Methods).

