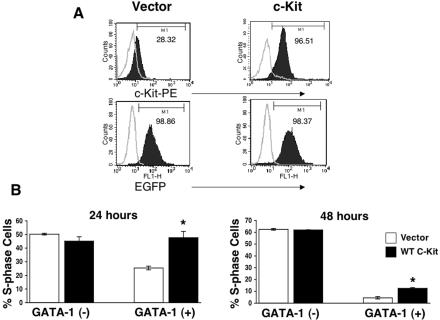
FIG. 7.
Sustained expression of c-Kit in G1E-ER4 cells results in partial reversal of GATA-1-induced S-phase repression. (A) Cell surface expression of c-Kit in G1E-ER4 cells transduced with c-Kit induced to express GATA-1 for 48 h. Upper left panel, GATA-1-expressing G1E-ER4 cells transduced with the empty vector; upper right panel, GATA-1-expressing G1E-ER4 cells transduced with c-Kit. The bottom panel indicates EGFP expression in both lines. In upper panels (left and right), open histograms indicate the level of background expression as measured by isotype control staining. Closed histograms indicate the level of c-Kit expression. In the bottom panels, closed histograms indicate the level of EGFP expression in transduced cells compared to that of nontransduced cells (open histograms). (B) G1E-ER4 cells overexpressing c-Kit or the empty vector were subjected to cell cycle analysis in the absence or in the presence of GATA-1 expression after 24 and 48 h. Bars denote the percentage of cells in S phase of the cell cycle ± SD of two independent experiments performed in triplicates. Asterisk indicates P < 0.05 (c-Kit versus vector).

