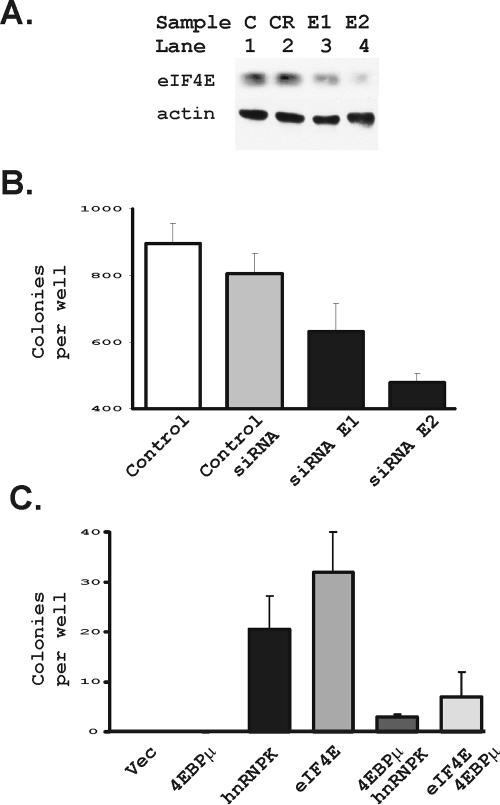
FIG. 10.
hnRNP K transforms cells through effects on eIF4E expression. (A) Rat1A cells were transfected with a control RNA (CR) and two siRNAs for eIF4E (E1 and E2) as described in Materials and Methods. Protein extracts were made 48 h after transfection and evaluated for eIF4E and actin levels by immunoblotting. An untransfected control lane is also included (lane C). (B) Rat1A cells expressing hnRNP K from Fig. 7 above were transfected with the control siRNA and the two siRNAs from panel A. Additional hnRNP K-expressing cells were examined without transfecting them (control). At 48 h after transfection the cells were seeded for a soft agar assay. The mean and standard error of colonies per well, evaluated 8 days after the cells were put in soft agar for each condition, were plotted. (C) Rat1A transfectants were evaluated for transformation in a standard soft agar assay. Shown are cells transfected with a vector control, a dominant inhibitor of eIF4E function (4EBPμ), hnRNP K, eIF4E, the combination of the dominant inhibitor of eIF4E, together with hnRNP K, and the combination of eIF4E, together with the dominant inhibitor of eIF4E, as indicated in the figure. Plotted is the mean and standard deviation of the cells per well for four wells each in two separate repeats of the experiment.

