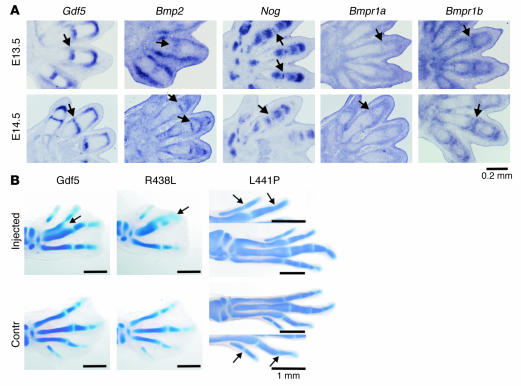
Figure 6.
Expression analysis during joint development and overexpression of Gdf5 in vivo. (A) In situ hybridization on mouse limb sections at E13.5 and E14.5 with probes specific for Gdf5, Bmp2, Nog, Bmpr1a, and Bmpr1b. The area of joint formation is indicated by arrows. Note strong expression of Gdf5 at both stages but Bmp2 expression in the joint only at E14.5. The longitudinal stripes of Bmp2 expression in the joint area at E13.5 correspond to expression in developing ligaments and not the joint interzone. Nog was expressed in a small band of cells in the joint interzone at E13.5 but not at E14.5. Bmpr1b was expressed in chondrocytes flanking the joint interzone. Bmpr1a shows ubiquitous expression with higher levels in the perichondrium and the developing joints. (B) Overexpression of WT Gdf5 as well as the Gdf5 mutants R438L and L441P in chick embryos using RCAS retroviral system. Alcian blue staining was used to visualize cartilage. For comparison, the injected left limb is shown next to the uninfected right limb, which serves as the control. Note enlargement of skeletal elements, joint fusions, and fusions between digits in WT Gdf5 and R438L mutant infected limbs at stage HH32. Changes in the L441P-injected limb were less severe and were only observed at a later stage (HH34–35). A higher magnification (arrows in B) shows joint fusions. Magnification, ×10 objective (A); ×1.6 objective (WT Gdf5 and R438L in B); ×1.25 objective (L441P in B) (AxioCam HRc camera; Zeiss).

