
Fig. 5. Real actograms and phase response curve (PRC). (A).
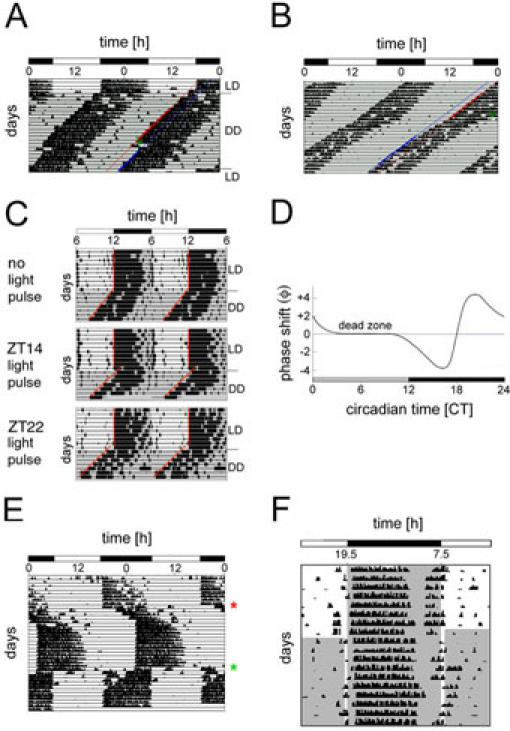
Plot of mouse locomotor activity before and after administering a light pulse (LP) at CT14 provoking a phase delay. The mouse was entrained to an LD 12:12 cycle before it was released into constant darkness (DD). The line above “DD” indicates the transition from LD to DD. When a stable free-running rhythm was established, a LP (green arrow) was administered at CT14 for 15 min. In order to quantify the phase shift, regression lines are drawn through 10 activity onsets before (red) and through 6 onsets after (blue) the LP. The horizontal distance between them corresponds to the phase shift triggered by the LP. (B) Plot of mouse locomotor activity before and after administering a LP at CT22 provoking a phase advance. The mouse was entrained to LD 12:12 (not shown) and then released into DD. As soon as a stable free-running rhythm was established, a LP (green arrow) was administered at CT22 for 15 min. In order to quantify the phase shift, regression lines are drawn through 6 activity onsets before (red) and through 7 onsets after (blue) the LP. The horizontal distance between them corresponds to the phase shift triggered by the LP. (C) Typical actograms of wild-type mice subjected to an Aschoff type II protocol. Mice were entrained to an LD 12:12 cycle (10 days) before releasing them into DD. The line above “DD” indicates the transition from LD to DD. The grey background represents darkness. Upon release into DD, no light pulse was administered to the mouse in the upper panel, whereas light pulses of 15 min were applied to the mouse at ZT14 (middle panel) and ZT 22 (lower panel). Regression lines (red) are drawn through the onsets of wheel-running activity in order to calculate the phase shift. Adapted from (26). (D) Typical light phase response curve (PRC) for nocturnal rodents. The grey and black bars below the PRC indicate subjective day and night, respectively. The X-axis shows the circadian time (CT) at which the light pulse was applied whereas the Y-axis displays the observed phase shift (f) [h]. Light pulses administered between CT11 and CT18 provoke a phase delay (negative values). Light pulses between CT19 and CT3, on the other hand, generate phase advances (positive values). Between CT4 and CT10, no phase shift can be observed (dead zone). (E) Jet lag can be mimicked in the lab by subjecting entrained animals to a rapid shift in the lighting schedule. This actogram shows the locomotor behavior of a mouse that was first entrained to LD 12:12 with light from 6 am to 6 pm. After 10 days, the lighting schedule was still LD 12:12 but shifted to "lights on" at 2 pm and "lights off" at 2 am (red star). The mouse only entrains after around 7 days of transition to the new LD cycle. 17 days after the first shift, the lighting schedule was again shifted to the original schedule (LD 12:12 from 6 am to 6 pm; green star). (F) Panel F shows an actogram of a mouse subjected to a skeleton photoperiod. The mouse was first entrained to LD 12:12 with lights on from 7:30 am to 7:30 pm for 8 days. The grey background represents lights off, whereas the white area stands for lights on. After day 8, an asymmetrical skeleton photoperiod was applied with a shorter pulse in the evening (dusk) and a longer one in the morning (dawn). Due to the two light pulses, the mouse remains entrained and wheel-running activity does not differ tremendously compared to LD 12:12. Adapted from ref. 31. LD, light-dark cycle; h, hours; DD, constant darkness.