
FIGURE 1.
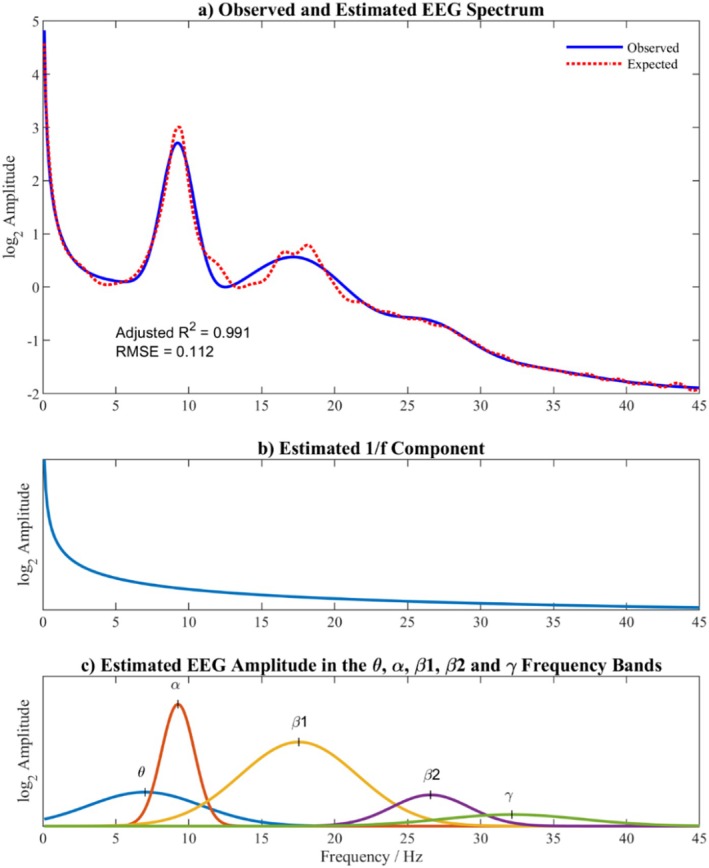
The model EEG density spectrum. (a) shows an individual's observed spectrum compared with the modeled spectrum; (b) shows the 1/f slope; (c) shows the five Gaussian components representing the theta, alpha, beta1, beta2, and gamma frequency bands.