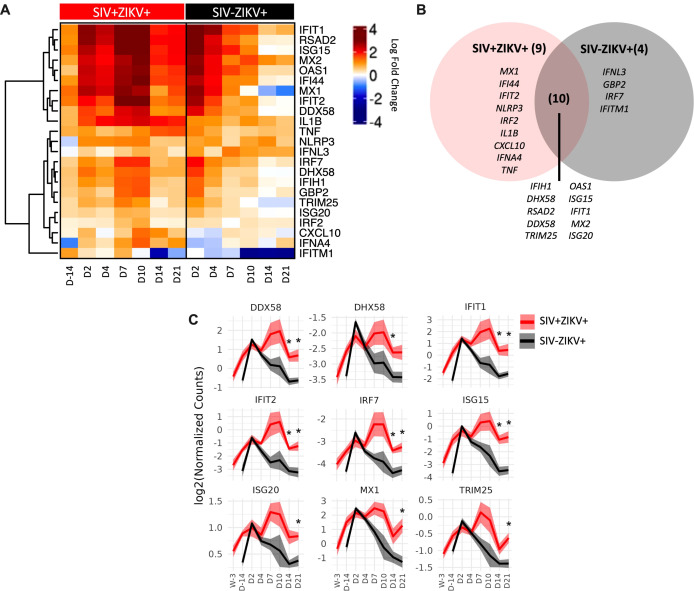
Figure 5.
SIV-ZIKV co-infection induces persistent innate immune activation in PBMC. (A) Heatmap showing the Log2FC expression of 23 genes that were significantly different (p-value <0.01) in at least one timepoint and one group. Log2FC expression for the SIV+ZIKV+ group is relative to pre-SIV (Wk-3). Log2FC expression for the SIV-ZIKV+ group is relative to pre-ZIKV (D-14). Genes’ Log2FCs were clustered using Pearson and Ward.D2. (B) Venn diagram of shared and unique genes that were significantly upregulated post-ZIKV. (C) Line plots of select gene kinetics representing the mean of all SIV+ZIKV+ (red) or SIV-ZIKV+ (black) animals. The log2 normalized counts are plotted at each timepoint. The line represents the mean and the standard error is shown as the confidence interval around the mean. p-values * <0.01 indicates a significant difference between SIV+ZIKV+ and or SIV-ZIKV+ at a specified timepoint.

