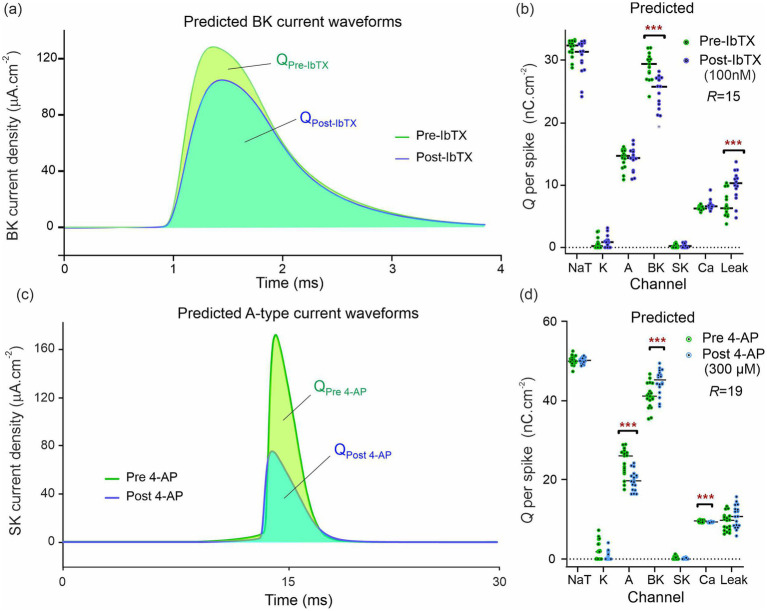
Figure 4.
Predicted ion current waveforms pre- and post-inhibition. (A) Predicted BK current waveforms before and after application of Iberiotoxin (100 nM). The pre-IbTX current trace is the average of 15 waveforms obtained by integrating the conductance model with parameters {}. The post IbTX traces were similarly obtained from parameters {}. (B) Predicted ionic charge transferred through each ion channel of the CA1 neuron before and after IbTX. Each dot is obtained from the integration of a BK current waveform predicted by the model constructed from one of the R = 15 assimilation windows in Figure 2. The green dots are the charge predictions pre-drug and the blue dots are the charge predictions after 100 nM IbTX was applied. The median charge is shown by the horizontal bars. Asterisks (***) indicate multiplicity adjusted q values from multiple Mann–Whitney U tests using a False Discovery Rate approach of 1%. (C) Predicted A-type current waveforms before and after application of the 4-aminopyridin. (D) Predicted ionic charge transferred through each ion channel of the CA1 neuron before and after 4-AP. The data in (A,B) were generated from one animal and the data in (C,D) from another animal. These data are exemplar of the recordings taken on the 13 animals we have studied in total.

