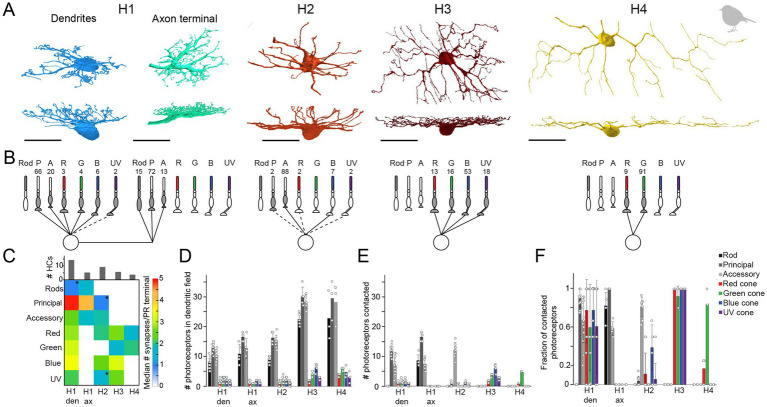
Figure 6.
Quantification of horizontal cell type specific contacts to photoreceptors. (A) Volume reconstructions of each horizontal cell type. In total, we identified four horizontal cell types namely H1 (dendrites n = 35, axons n = 5), H2 (n = 21), H3 (n = 6), and H4 (n = 3). All scale bars: 20 μm. (B) Network motifs for each horizontal cell type. The numbers above each photoreceptor type represent the fraction of synapses/photoreceptor type in percent. Dashed lines indicate that this photoreceptor cell type was rarely (<3%) contacted by the respective horizontal cell. P, principal member of a double cone; A, accessory member of a double cone; R, red single cone; G, green single cone; B, blue single cone; UV, ultraviolet single cone. (C) Connectivity matrix with the median number of synapses/photoreceptor (PR) terminal per horizontal cell type. Histograms above the connectivity matrix indicate the number of cells that were included in the analysis. Connections between horizontal cells and photoreceptor cells that are highlighted by an asterisk only occurred in a few individual horizontal cells; den = dendrites; ax = axon terminal. (D) Mean number ± standard deviation (SD) of rod and cone terminals within the dendritic field of different horizontal cells. (E) Mean number ± SD of contacted photoreceptor cells/type for different horizontal cell types. (F) Mean fraction ± SD of contacted photoreceptors from photoreceptors in the dendritic field of different horizontal cell types.

