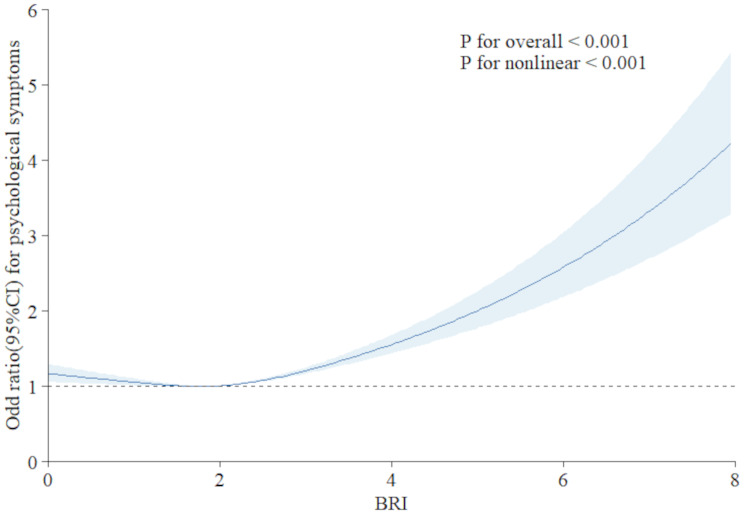
Fig. 5.
Dose-response relationship curve between BRI and psychological symptoms in Chinese adolescents
Note: Data were fitted by a logistic restricted cubic spline regression model adjusted for age, family economic income, sleep duration, snack consumption, standing long jump, and 50-meter run with 3 knots at the 10th, 50th, 90th percentiles of BRI (reference is the median). OR, odds ratio; CI, confidence interval; BRI, body roundness index

