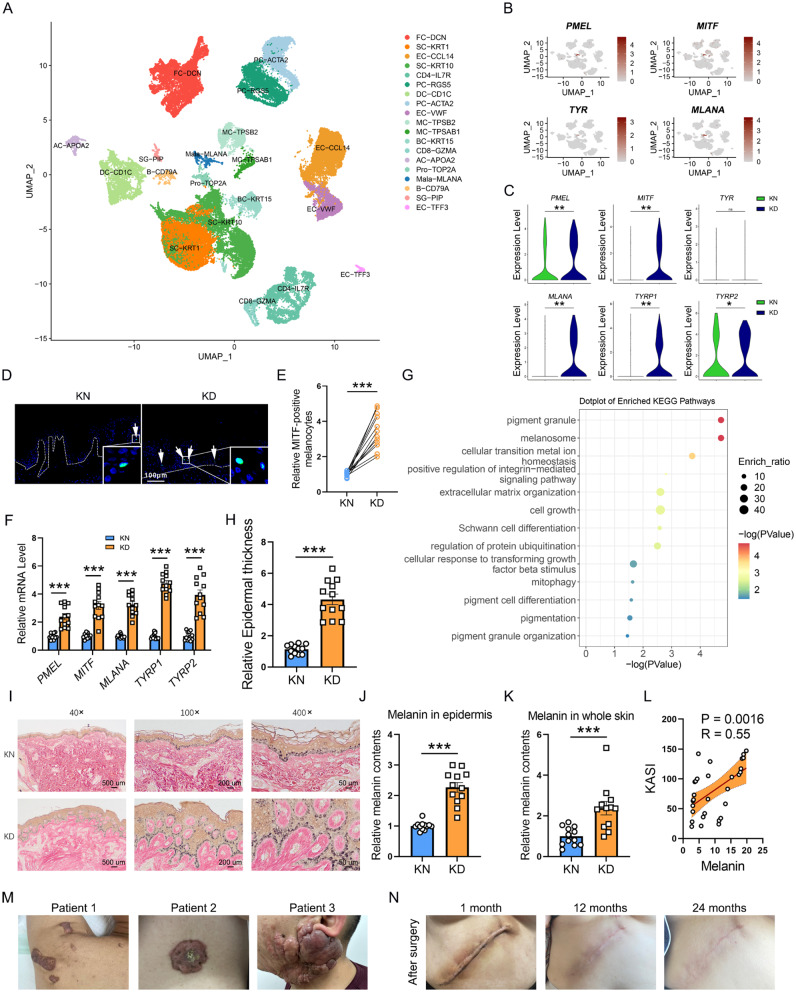
Fig. 1.
Hyperactive pigmentation in melanocyte cells from KD patients. (A) UMAP of the cell clustering from skin tissues by scRNA-seq analysis. (B) Re-clustering of melanocytes by PMEL, MITF, TYR, and MLANA. (C) The mRNA levels of PMEL, MITF, TYR, and MLANA in KD and KN skin tissues by scRNA-seq analysis. (D-E) Immunofluorescence assay and cell count of MITF-positive melanocytes in epidermis of skins. The dashed white lines represent the epidermis above and the dermis below. N = 12. Scale bar: 100 μm. (F) PMEL, MITF, MLANA, TYRP1, and TYRP2 levels in keloid skin tissues by quantitative Real-time PCR (qPCR) analysis. N = 12. (G) KEGG analysis of the Differentially Expressed Genes (DEGs) of melanocytes between KD and KN from scRNA-seq. (H) Epidermal dermal thickness changes between KD and KN skin tissues. (I-J) Masson-Fontana staining (I) and quantification (J) of melanin contents in skin epidermis. N = 12. 40×, 100×, and 400× means the images are magnified by 40, 100, and 400 times, respectively. Scale bar: 500 μm, 200 μm and 50 μm in 40×, 100× and 400×, respectively. (K) Quantifying isolated melanin from skin tissues by spectrophotometric measurement at 490 nm of absorbance. N = 12. (L) The correlations between KASI and melanin (N = 30). (M-N) The photos of keloid patients. *P < 0.05; **P < 0.001; ***P < 0.001

