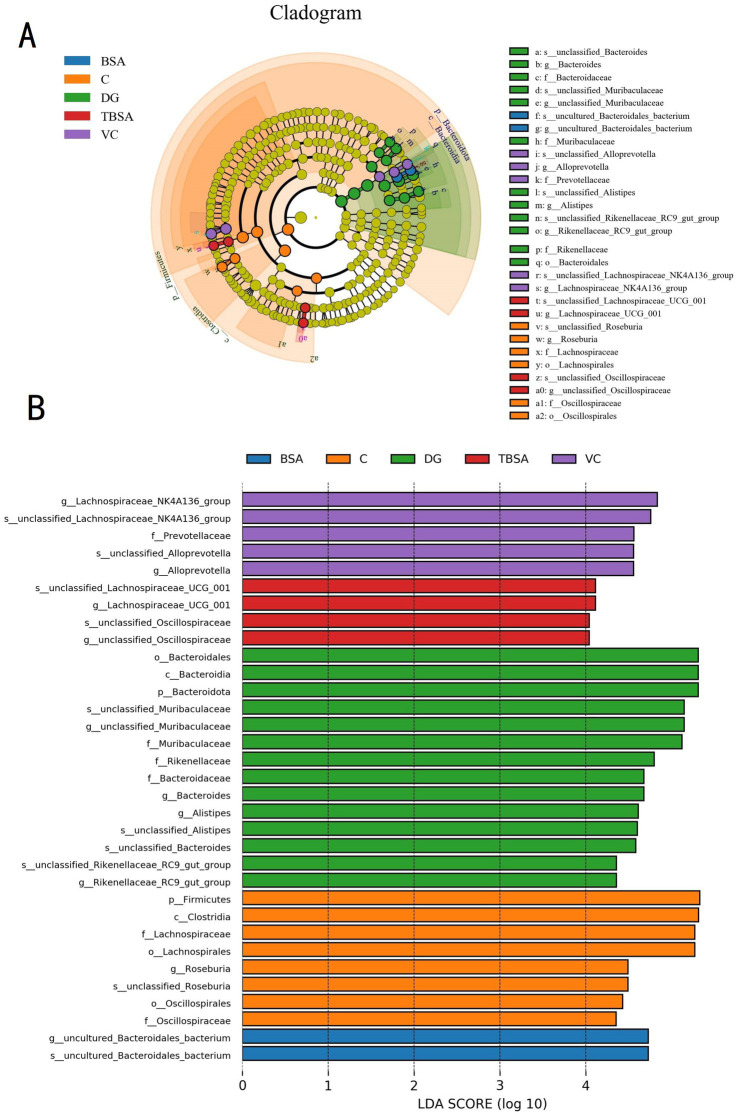
Figure 8.
LEfSe analysis combined with LDA scores revealed the differential biomarkers among five groups. (A) The cladogram illustrates the phylogenetic distribution of diverse bacteria. (B) The linear discriminant analysis (LDA) scores, with thresholds exceeding 4, were indicated statistically significant differential bacteria.

