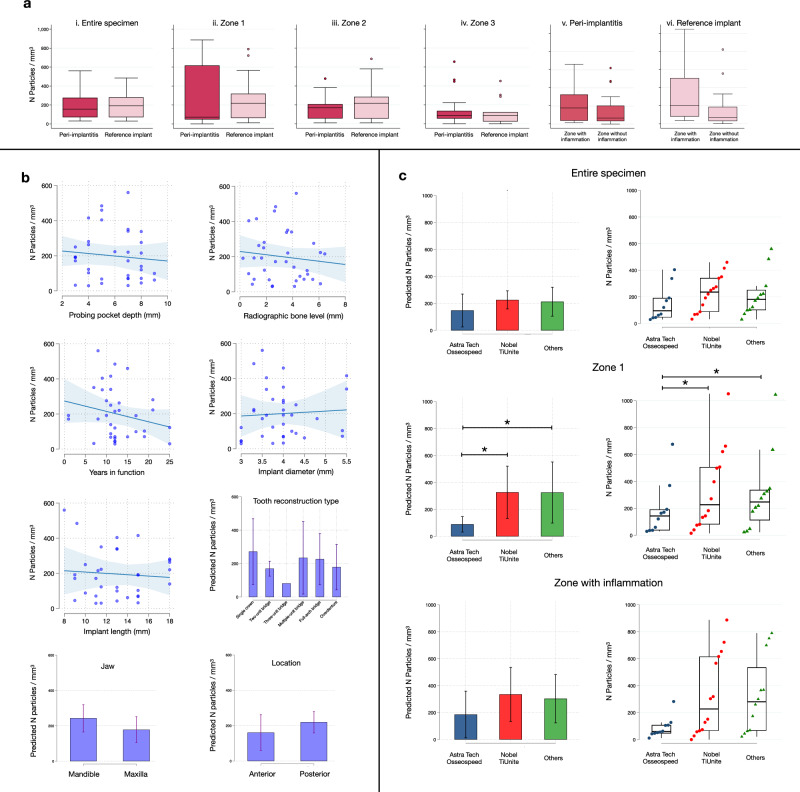
Fig. 3. Results of μ-PIXE analysis.
a Boxplots illustrate the volumetric density of titanium micro-particles observed in different ROIs in peri-implantitis (n = 18) and reference implant samples (n = 18; with exception of Zone 3 where n = 15). Median and IQR. Circles represent outliers. b Results of linear regression analysis: clinical measurements and implant-related characteristics. Scatterplots: each dot represents one implant (n = 36); bar graphs: mean and 95%CI. c Results of linear regression analysis: volumetric density of titanium micro-particles by implant system observed in the “entire specimen”, “zone 1” and “zone with inflammation” ROIs. Implant systems were grouped in three categories: Astra Tech Osseospeed (n = 10), Nobel TiUnite (n = 14), Others (n = 12). More details can be found in Table 1. Bar graphs: mean and 95% CI. Strip plots: median and IQR. Each dot represents one implant. *p = 0.024 (Astra Tech Osseospeed vs Nobel TiUnite); p = 0.047 (Astra Tech Osseospeed vs Others).

