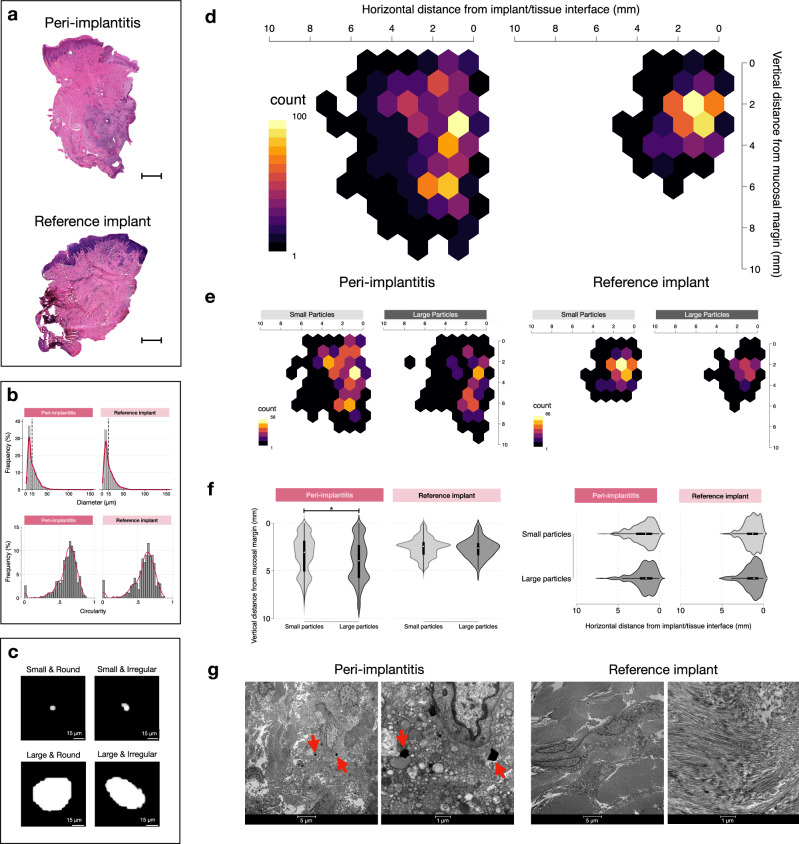
Fig. 4. Results of μ-PIXE analysis (continued).
a Representative Hematoxylin & Eosin micrographs in one peri-implantitis and one reference implant specimen. The implant/tissue interface is found on the right side of the samples. Magnification 20×. Scale bars: 1 mm. b Distribution of diameter and circularity values of titanium particles in peri-implantitis (n = 1228) and reference implant (n = 663) sites. K-densities represented by red continuous lines. c Representative images of titanium micro-particles depending on size and shape. d Heatmaps illustrating the distribution of titanium micro-particles based on results from linear measurements in peri-implantitis and reference implant specimens. e Heatmaps representing the distribution of small and large particles based on results from linear measurements in peri-implantitis and reference implant specimens (peri-implantitis: small particles n = 755, large particles n = 473; reference implants: small particles n = 41, large particles n = 251). f Violin plots representing the distribution of small and large particles based on results from linear measurements in peri-implantitis and reference implant specimens. *p < 0.0001, Mann-Whitney U test. g Representative TEM images illustrating sections from peri-implantitis and reference implant specimens. Red arrows indicate metal-like particles. Magnification: 1600× & 6700×.

