
Figure 11.
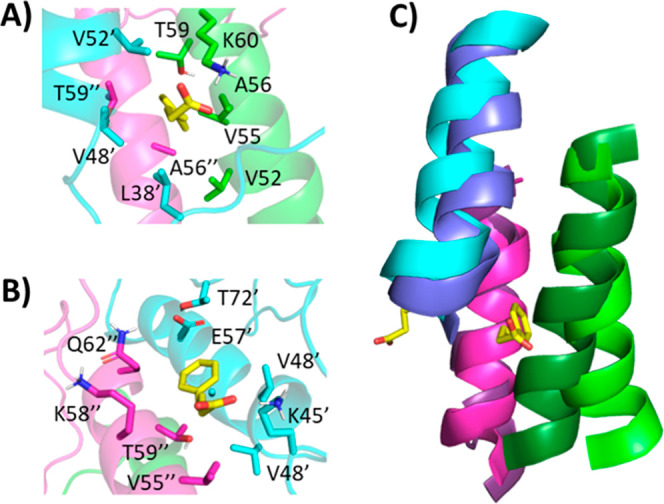
Binding of two PBA molecules (A,B) to trimeric α-Syn following 25 ns MD simulation replicant 1. Each α-Syn chain is represented as a differently colored cartoon, while PBA molecules are shown as salmon spheres. (C) The orientation between the trihelical bundles following 25 ns for unbound (darker shades) and PBA-bound (lighter shades) systems.