Figure 4.

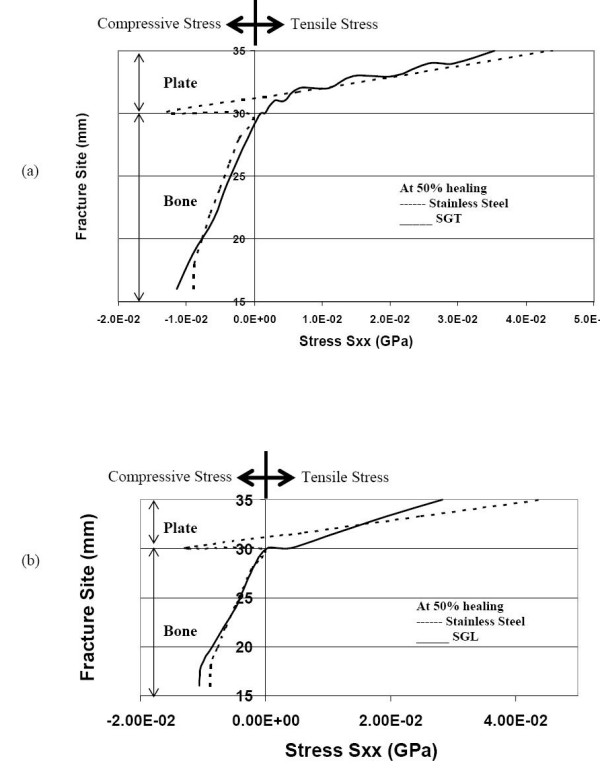
Normal stress distribution at the fracture interface (during 50% healing) (a) comparison of stresses for SGT and SS (b) comparison of stresses for SGL and SS.

Normal stress distribution at the fracture interface (during 50% healing) (a) comparison of stresses for SGT and SS (b) comparison of stresses for SGL and SS.