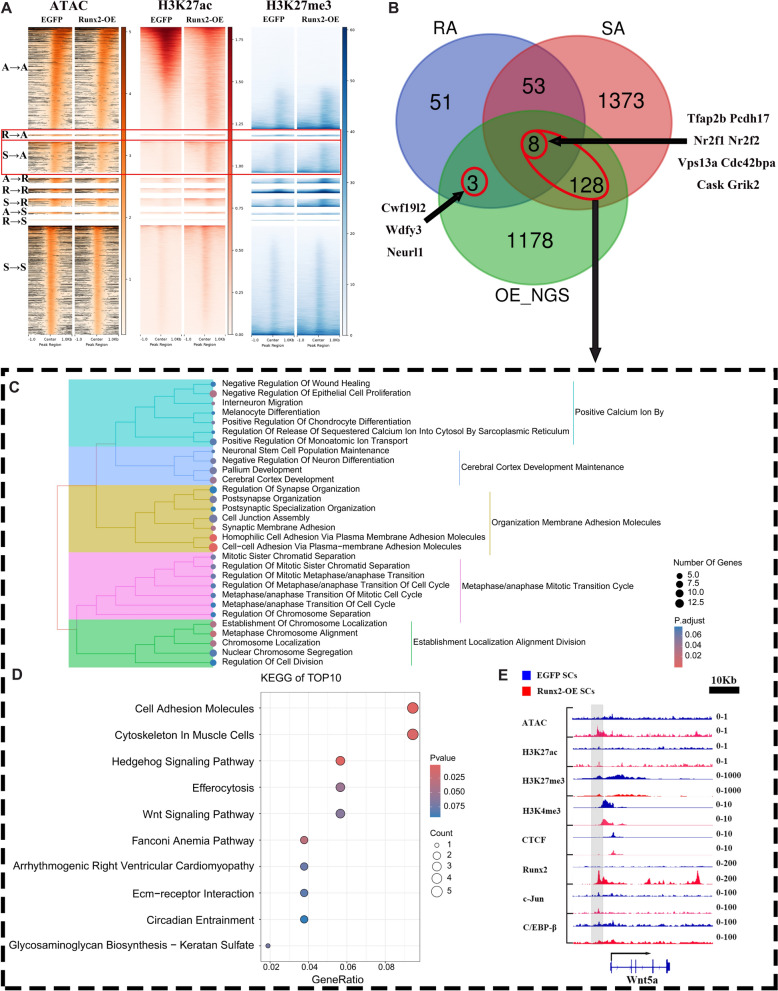
Fig. 6.
Comprehensive Multi-omics Analysis of Transcriptional Activity Dynamics in Schwann Cells Following Runx2 Overexpression (Runx2-OE). Heatmap visualization depicting the spatial distribution of chromatin accessibility (ATAC) and histone modifications (H3K27ac, H3K27me3) relative to transcription start sites (TSS) across distinct regulatory states after Runx2-OE. Regulatory states are classified as Active (A), Repressed (R), or Silent (S). Red boxes highlight gene sets transitioning from Repressed to Active (RA) or Silent to Active (SA) states. Venn diagram illustrating the intersection of three gene sets, including genes transitioning from Repressed to Active (RA), genes transitioning from Silent to Active (SA), upregulated genes following Runx2 overexpression (OE_NGS). Red circle emphasizes the overlapping gene subset. C-E) Functional characterization of genes co-identified in SA and OE_NGS intersections. C Gene Ontology (GO) enrichment analysis. Circle size correlates with the number of differentially expressed genes per category. Color intensity (darker red) indicates statistical significance (p-value). D KEGG pathway enrichment analysis. Circle size represents the number of differentially expressed genes per pathway. Color gradient reflects statistical significance. E Representative genome browser view (IGV) of the Wnt5a locus (scale bar = 10 kb). Blue represents the EGFP group, red bands represent the Runx2-OE group, and gray areas indicate regions with dramatic peak changes between different tracks

