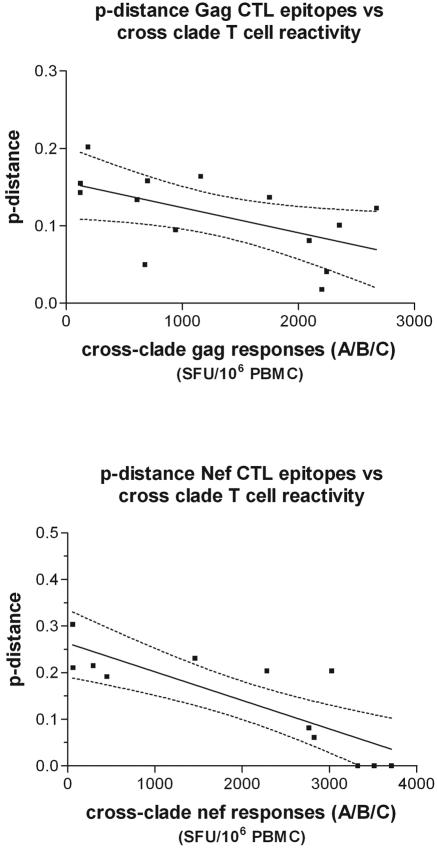
FIG. 3.
Correlation between T-cell responses and genetic distance. The genetic distance (p distance) between documented CTL epitopes for the patient-specific HLA-type was correlated with T-cell responses for Gag (top) and Nef (bottom). Correlations were made using Spearman's rank test and are shown together with 95% confidence intervals (dashed lines). All correlation results are summarized in Table 3.

