FIG. 3.
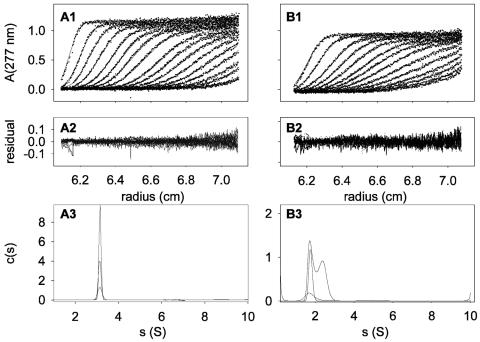
Sedimentation velocity of CHCV169*: Experiments were done in 20 mM Tris pH 8.0, 150 mM NaCl, 1 mM DTT, in the presence of 0.1% of DM (A panels) or C12E8 (B panels). Panels A1 and B1 show a selection of experimental (dots) and fitted (line) profiles. In panels A1 and B1, the last profile corresponds, respectively, to 8 h 30 min and 11 h of sedimentation at 42,000 rpm and 20°C. Panels A2 and B2 show the superposition of differences between the experimental and fitted profiles. Panels A3 and B3 show the results of the analysis made in terms of a continuous distribution of species (see the text).

