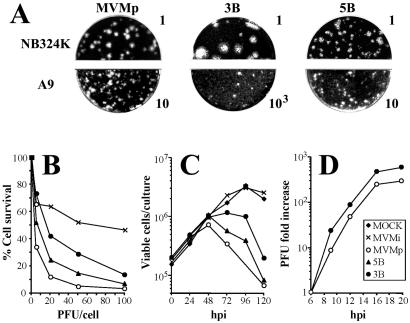
FIG. 2.
Features of the isolated MVMp variants in culture. (A) Plaque phenotype of MVMp and of the 3B and 5B virus variants in two fibroblast cell lines. Numbers are arbitrary units to designate the infectious titers (PFU) of the inocula. (B) Killing of mouse A9 cells. Monolayers of A9 cells were inoculated at 37°C with MVMp viruses at the indicated MOI normalized by a PFU assay in NB324K cells, and viable cells were determined as countable colonies 10 days afterwards. Represented is the average from five independent experiments. (C) Viral progression. Cultures of 3 × 10⁵ A9 cells were inoculated at an MOI of 0.1, and the numbers of viable cells were counted by trypan blue exclusion as a function of time. The result is the average of two determinations. (D) Virus yield in a one-step growth assay. Cultures of highly synchronized A9 cells (19) were inoculated at an MOI of 20, and the total infectious virus levels were determined as PFU as a function of time. The figure shows the average of three independent experiments.

