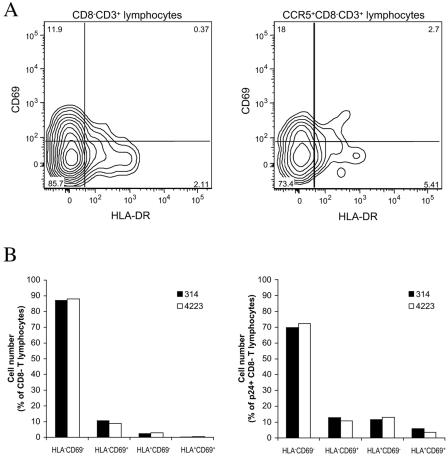
FIG. 3.
Activation status of lymphocytes in HIV-1-infected human lymphoid tissues ex vivo; comparison of the distributions of activation markers among different cell populations in uninfected lymphoid tissue and in ex vivo-infected tissue after 12 days in culture. The data were obtained in experiments using 54 pooled tissue blocks per condition from a single donor. (A) Distributions of CD69 and HLA-DR among CD8− CD3+ lymphocytes and CCR5+ CD8− CD3+ lymphocytes in uninfected tissue; one representative experiment out of six is shown. The contour plots are at log 50% probability. (B) Distributions of CD69 and HLA-DR among CD8− CD3+ lymphocytes (left) and p24+ CD8− CD3+ lymphocytes (right) in tissue infected with isolates 314 and 4223 from patient 1047; one representative experiment out of six matching that presented in panel A is shown.

