
Figure 3.
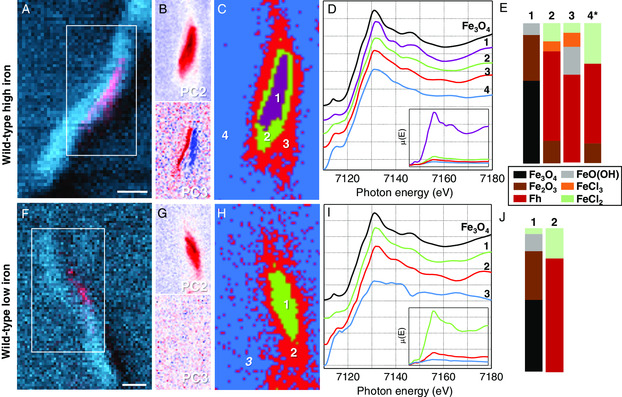
Nano‐XANES data for MTB with complete magnetosome chains. A,F) WT‐high‐iron and WT‐low‐iron nano‐XANES regions (white box), B,G) PCA maps (red signal), C,H) maps of cluster centers, D,I) normalized offset Fe K‐edge XANES spectra (inset with normalized spectra retaining edge jump values), and E,J) a summarized composite of LC fitting results (* indicates R‐factor ≥ 0.02 from LC fitting result).