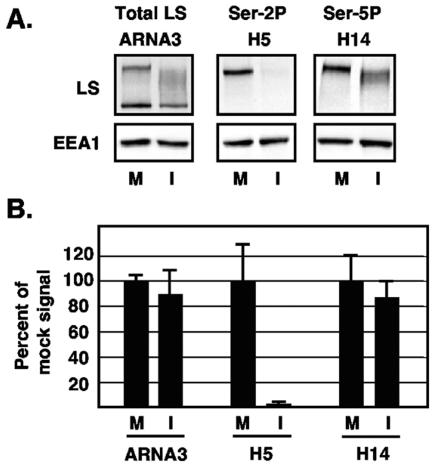
FIG. 3.
Quantitative immunoblot analysis of RNAP II LS forms after HSV-1 infection. Triplicate cultures of Vero cells were either mock infected (M) or infected with WT HSV-1 (I), and protein extracts were prepared at 8 hpi. Equal fractions of each extract were analyzed by immunoblotting with MAb ARNA3 to detect all forms of LS or MAbs H5 or H14 to detect Ser-2- or Ser-5-phosphorylated LS, respectively. As a loading control, cellular EEA1 was also analyzed. Signal intensities were determined by direct chemifluorescence imaging of the immunoblots using a Molecular Dynamics Storm 840 Imager. (A) Representative digital images of the data show the approximate areas of the blots that were quantitated. (B) Quantification of LS forms after HSV-1 infection. The chemifluorescence imaging data were quantitated by using ImageQuant analysis software. The RNAP II LS signal for each sample was normalized to the corresponding EEA1 signal to correct for protein loading variations. The mean values for mock-infected cells were defined as 100%, and the error bars represent standard deviations.

