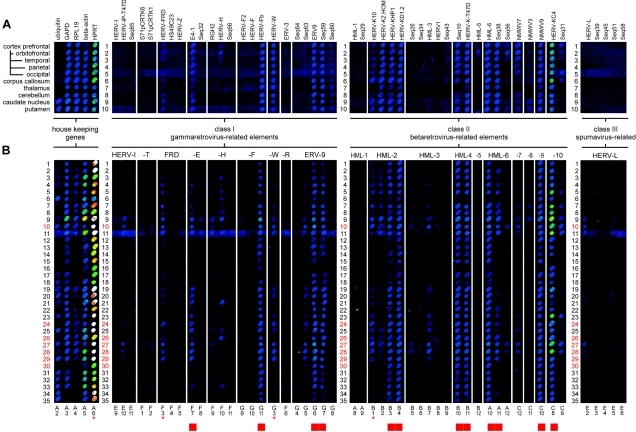
FIG. 2.
Alignment of false-color chip data sets corresponding to HERV class I, II, and III transcriptional activities observed in 10 different brain regions of a healthy human brain (A) and in prefrontal-cortex brain samples from 35 healthy individuals (B) by HERV microarray hybridization. A housekeeping-gene panel served as an internal control. For the origins and identities of the dots, see Table 1. QRT-PCR was performed for a subset of seven samples indicated by red numbers and a subset of three HERV elements (HERV-W, HERV-FRD, and HML-2) and the housekeeping gene HPRT, marked by red asterisks. HERV elements representing the brain-specific HERV activity profile are indicated by red boxes (bottom line).

