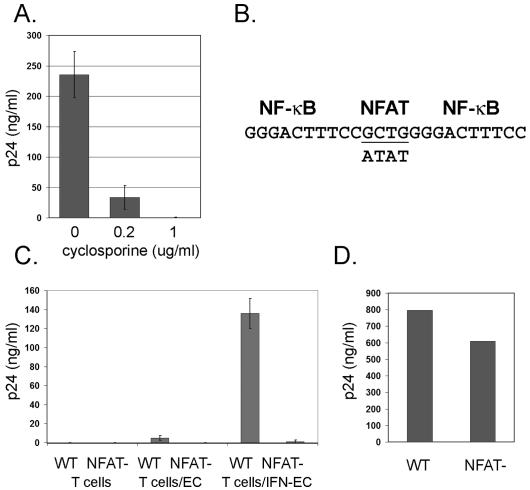
FIG. 6.
Characterization of the role of NFAT in HIV production. (A) HIV release on day 9 postinfection (representing the peak) from EC-T-cell cocultures treated with cyclosporine or vehicle (ethanol). The data are from one of three experiments with similar results. (B) Schematic diagram of the region of the HIV LTR that contains the NF-κB and NFAT binding sites. The underlined nucleotides are required for NFAT-LTR interactions. The nucleotides on the lower line indicate the loci that differ between the NFAT− strain and the wild-type derivative strain (upper line). (C) HIV released from T cells on day 9 postinfection (representing the peak). T cells represents T cells alone, T cells/EC represents T cells cocultured with untreated ECs, and T cells/IFN-EC represents T cells cocultured with ECs pretreated with IFN-γ. The data are from one of two experiments with similar results. (D) HIV released from CD4+ T cells isolated from PBMCs and pretreated with PHA and IL-2 on day 8 postinfection (representing the peak). Similar results were obtained using the cell line CEMx174 (not shown). HIV release was assessed by p24 measured in the supernatant by ELISA. The error bars indicate standard deviations.

