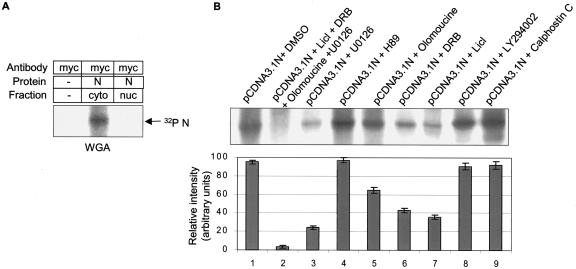
FIG. 4.
Effect of different inhibitors on N phosphorylation. (A) pCDNA3.1 N-transfected cells were treated with wheat germ agglutinin (20 μg/ml) during the starvation and labeling period. Cytoplasmic (lane 2) and nuclear (lane 3) fractions were immunoprecipitated using anti-Myc antibody, resolved by 12% SDS-PAGE, and the protein bands were detected by fluorography. Lane 1 represents pCDNA3.1-transfected cells treated with wheat germ agglutinin (WGA) whole-cell extract processed simultaneously. (B) pCDNA3.1 N-transfected cells were treated with different inhibitors, labeled with [32P]orthophosphate, and the samples were subsequently immunoprecipitated using anti-Myc antibody. The upper panel shows a representative gel. The band intensities were quantified from three independent sets of experiments and the average relative intensity ± standard deviation was calculated as shown in the bar graph.

