
Figure 5.
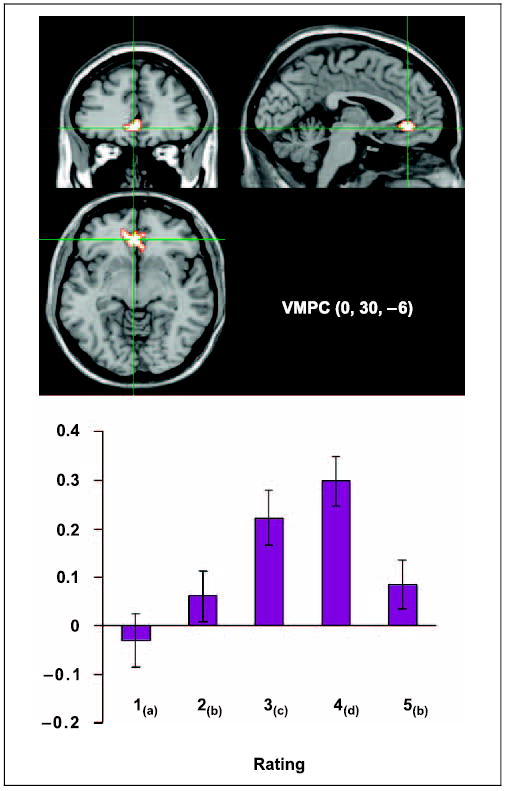
Region of the VMPC that modulates linearly with 1–4 ratings. The graph represents the model amplitude fitted in SPM99 for all ratings within the voxel identified by the group maxima (0, 30, −6). Ratings with subscripts in common are not significantly different from each other ( p < .05). The y-axis is percent signal change and error bars represent the standard error of the mean across subjects.