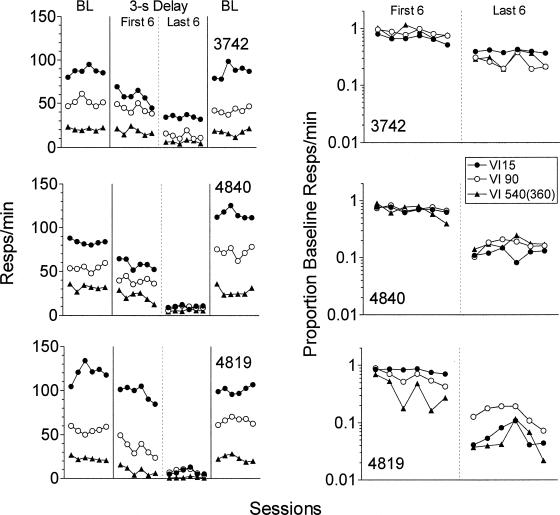
Figure 1. The left panels show response rates for each component in the last six sessions of exposure to the two immediate reinforcement baseline (BL) conditions and the first six and last six sessions of exposure to the 3-s delay condition.
The right panels show response rates in the first six and last six sessions of the 3-s delay condition as a proportion of the preceding immediate reinforcement baseline.
The y axis in the right panels is logarithmic.

