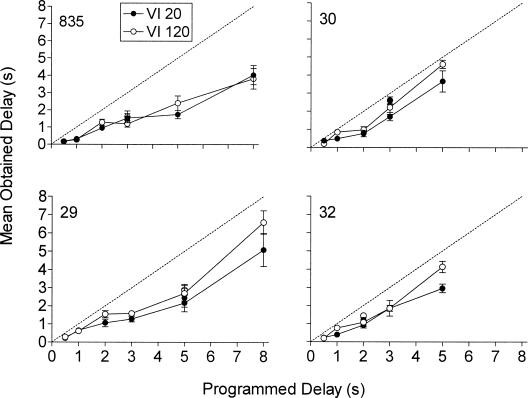
Figure 5. Mean obtained delays of the last six sessions of exposure to each delay condition as a function of the programmed delay.
Data points not connected by the lines are from the replicated delay condition.
Error bars represent ± 1 SD.
The dotted line denotes equivalence between programmed and obtained delays.

