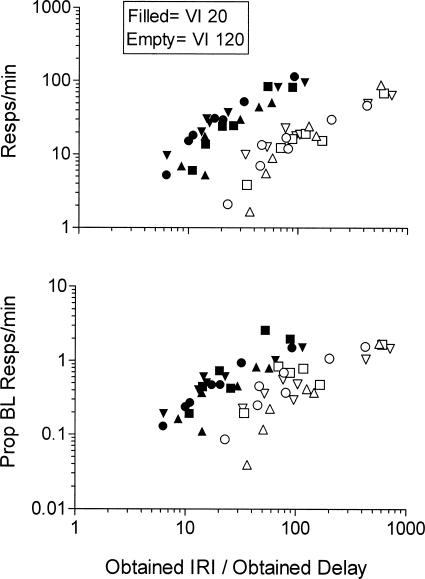
Figure 7. The top panel shows response rates in the last six sessions of exposure to each delay condition plotted as a function of the ratio of the obtained IRI and the obtained delay duration.
The bottom panel shows a similar analysis with responding presented as a proportion of response rates in the preceding immediate reinforcement baseline condition.
In both panels, data for individual pigeons are represented by different symbols.
Pigeons 835, 30, 29, and 32 are represented by inverted triangles, triangles, circles, and squares, respectively.
Both axes are logarithmic.

