Figure 2.
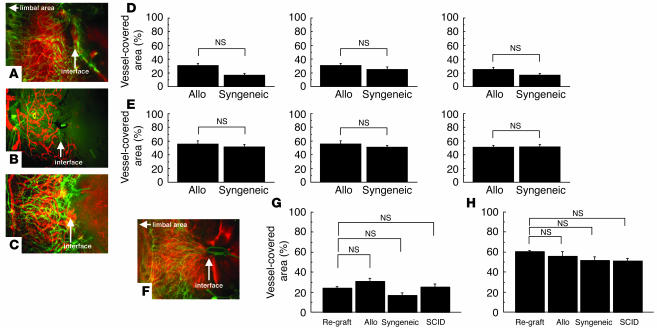
Comparison of hemangiogenesis and lymphangiogenesis after PKP. (A–C) Photomicrographs of immunofluorescence images 7 days after PKP. (A) Allogeneic (Allo) transplantation. (B) Allogeneic transplantation in SCID mice. (C) Syngeneic transplantation. (D and E) Spot image analysis of lymphangiogenesis visualized by LYVE-1 staining (red) (D) and hemangiogenesis (green) (E) detected by PECAM-1 staining in each transplantation group. (F) Allogeneic transplantation in presensitized hosts. (G and H) Spot image analysis of lymphangiogenesis (G) and hemangiogenesis (H) in each transplantation group. Magnification, ×100.

