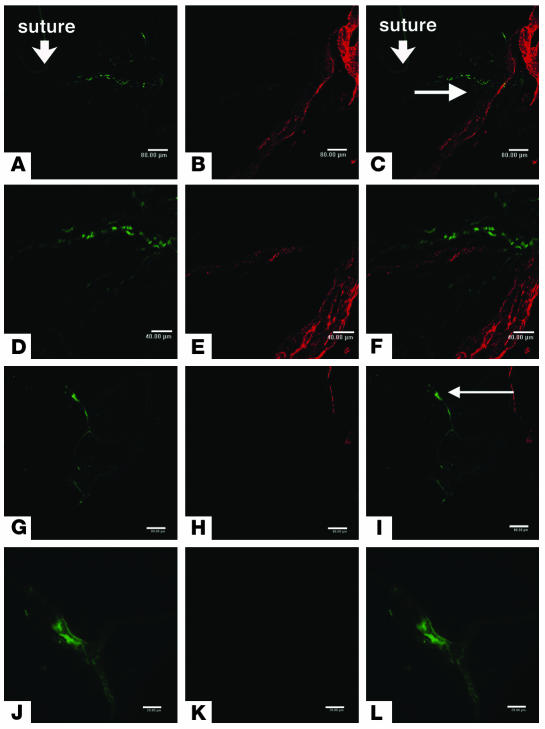
Figure 5.
Involvement of EPCs in lymphatic vascular development following corneal suture. (A–C) Tie2-LacZ mouse cornea. Cy2-visualized β-gal (A) and Cy3-visualized LYVE-1 (B) staining. (C) Overlay of A and B showing dual expression. (D–F) Higher magnification view of area indicated by arrows in A and C. Cy2-visualized β-gal (D) and Cy3-visualized LYVE-1 (E) staining. (F) Overlay of E and F showing dual expression. (G–I) LacZ expression at the blood vessel, not lymphatic in Tie2-LacZ chimera mouse cornea. Cy2-visualized β-gal (G) and Cy3-visualized LYVE-1 (H) staining. (I) Overlay of G and H showing dual expression. (J–L) Higher magnification view of area indicated by arrow in I. Cy2-visualized β-gal (J) and Cy3-visualized LYVE-1 (K) staining. (L) Overlay of J and K showing dual expression. Scale bars: 80 μm (A–C and G–I), 40 μm (D–F), and 20 μm (J–L).

