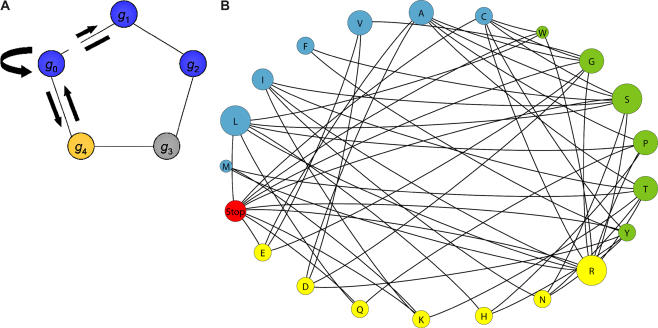
Figure 2. Mutational Networks.
(A) Five alleles lie on a mutational pentagon with genetic degeneracy for the A phenotype. Colors indicate phenotypes with blue for A, yellow for B, and gray for V. Edges indicate that an allele on one side can mutate to the allele on the other side. Arrows illustrate the dynamics in equation 2.
(B) Each vertex represents an amino acid. The size of the vertex indicates the number of codons coding for the amino acid. Edges indicate point mutations between hydrophobicity classes. Mutations that preserve hydrophobicity class, including those that preserve the amino acid, are included in the model but not depicted here. The color of the vertex corresponds to the hydrophobicity class: blue indicates hydrophobic, yellow indicates hydrophilic, green indicates intermediate, and red indicates stop codons [21]. This network was drawn with PAJEK [50].

