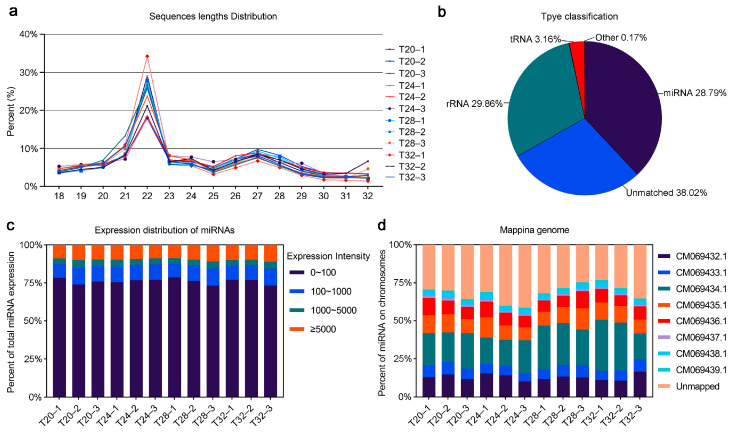
Figure 4.
MicroRNAome of A. leii following various temperature treatments: (a) length distribution of all unique reads of all cleaned reads from 12 samples; (b) type classification for all sRNAs. The percentages of different RNA classes, including miRNA, tRNA, rRNA, unmatched, and other, are shown in a pie chart; (c) expression distribution of miRNAs in each sample examined in the array analysis; (d) distribution of miRNAs across different chromosomes in A. leii.

