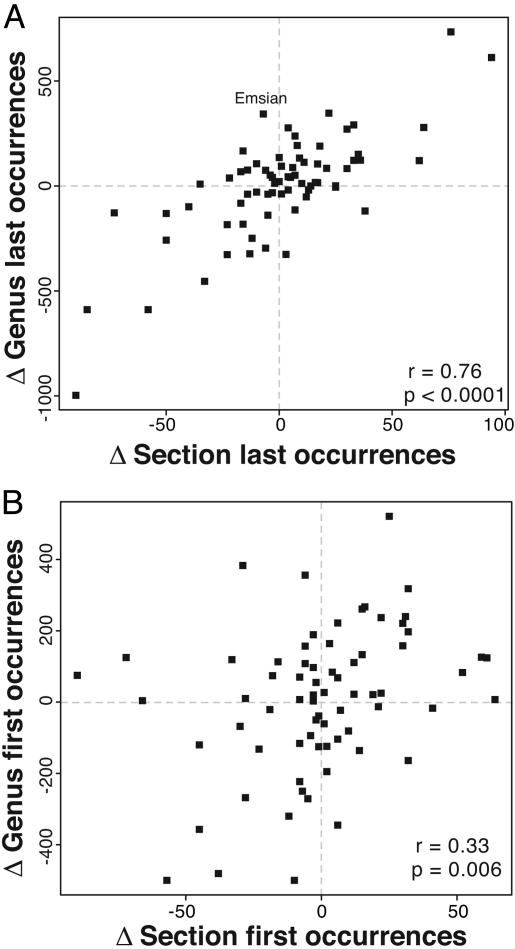
Fig. 3.
Scatterplots of first differences (value for an interval minus value for previous interval) for first and last occurrences of genera and sedimentary rock sections from Fig. 2. (A) Last occurrences. (B) First occurrences. Linear product–moment correlation coefficients and P values are shown. Correlations are also significant according to nonparametric tests (P < 0.002). Positive last occurrence outlier is labeled with stage name.

