



ABSTRACT
Background
Dental calculus accumulation varies across individuals. While various factors contribute to its accumulation, the role of salivary composition remains underexplored. This study aims to compare individuals suffering from rapid rates of dental calculus formation rates with those having slow formation rates in terms of salivary electrochemical properties as well as its proteomic, metaproteomic and elemental composition.
Methods
A total of 26 patients with a history of dental calculus were recruited. Saliva samples were collected and evaluated for electrochemical properties as well as elemental, proteomic and metaproteomic composition. Patients were provided scaling treatment to remove all calculus. Six months after the dental cleaning patients were re‐assessed for the presence of dental calculus. Based on the dental calculus formation rate participants were categorised into slow (57.7%) and rapid calculus formers (42.3%) that were then assessed for differences in salivary composition.
Results
Rapid calculus formers exhibited a more neutral zeta‐potential and lower concentration of salivary calcium ions than their slow‐forming counterparts. Proteomic analysis identified 895 proteins across all samples. Of these, 38 proteins were exclusive to the rapid formation group, while 24 proteins were specific to the slow group. The rapid group demonstrated augmented pathways related to cell binding (e.g., cytoskeletal regulation by Rho GTPase and integrin signalling), inflammatory mediation (e.g., chemokine and cytokine signalling) and neurodegenerative disorders (e.g., 5‐Hydroxytryptamine degradation, Huntington's disease and Parkinson's disease) and significant enrichment in peptidase inhibitor activity. In contrast, the slow group demonstrated enrichment mainly in immune response. Metaproteomic analysis for salivary bacteria showed significant predominance of Streptococci in the rapid group and elevated levels of Rothia in the slow group.
Conclusion
The saliva of patients with rapid calculus formation rates differs from that of patients with slow rates of calculus formation in terms of electrochemical properties as well as proteomic, metaproteomic and elemental composition.
Keywords: dental calculus, human saliva, metaproteome, proteomics, salivary proteome, zeta potential
1. Introduction
Dental calculus is mineralized dental plaque formed on dental and prosthodontic surfaces, and with a prevalence as high as 90% in the adult population, it is the predominant pathological calcification in humans. Calculus is principally composed of inorganic minerals, namely calcium carbonate and calcium phosphate, alongside organic constituents such as proteins and carbohydrates (Akcalı and Lang 2018). Given its propensity to harbour bacterial colonies adjacent to gingival tissues, dental calculus is a significant contributor to the onset and progression of both gingival and periodontal diseases (Forshaw 2022). Thus, its efficient control and removal are imperative for optimal periodontal health.
It is noteworthy that calculus formation rate is not uniform across the population and varies widely from individual to individual (Fons‐Badal et al. 2020). Despite stringent oral hygiene and plaque control measures, certain individuals are predisposed to rapid calculus accrual, necessitating more frequent dental interventions. Little is known about the reason behind differences in calculus formation rate across the population, though a confluence of factors, encompassing dietary habits, demographics and medical conditions, are postulated contributors. Specifically, diets rich in carbohydrates and lipids have been implicated in augmented calculus deposition, while protein‐rich diets appear to be protective (Hidaka and Oishi 2007). Demographic nuances, including advancing age, male sex and black racial backgrounds, have been associated with increased subgingival calculus prevalence. Furthermore, systemic conditions such as chronic kidney disease (Martins et al. 2012) and medications like beta‐blockers, diuretics, anticholinergics, synthroid and allopurinol have been identified as potential calculus modulators. A shared attribute across these variables is their impact on the composition and properties of saliva.
Saliva is composed of both organic and inorganic components, including a variety of electrolytes, proteins, mucins, nitrogenous products and bacteria (Humphrey and Williamson 2001). Saliva is indispensable for oral health, because of its lubricative, buffering and antibacterial functions, and its role in maintaining calcium equilibrium. Elevated salivary pH is associated with increased calculus index (D'Souza et al. 2023) and a surge in salivary flow rate augments the susceptibility to plaque mineralization and periodontitis (Rajesh et al. 2015).
Salivary ions, including calcium, phosphorus and urea, among others, have been investigated for their roles in calculus dynamics (D'Souza et al. 2023; Fons‐Badal et al. 2020; Pateel et al. 2017). An observational study documented that levels of phosphorus and urea were significantly elevated in patients with rapid calculus formation (Fons‐Badal et al. 2020). However, subsequent research failed to establish a direct correlation between salivary urea and calculus forming rate. Instead, a notable association emerged with increased levels of ureolytic bacteria, which metabolise salivary urea into ammonia. This metabolic shift induces a rise in ureolytic pH, leading to augmented calcium phosphate saturation, which, in turn, promotes enhanced calculus deposition (D'Souza et al. 2023). The salivary concentrations of uric acid, calcium, sodium, potassium and chlorine, however, did not demonstrate any significant correlation with calculus formation (Fons‐Badal et al. 2020).
Proteins are the main organic component of saliva (Castagnola et al. 2017). There are around 3000 distinct proteins in saliva, some of which, such as cystatins, statherin and acidic proline‐rich proteins (PRPs), are known to play a role in the homeostasis of calcium phosphate (Pateel et al. 2017). Their calcium‐binding capabilities emanate from specific negatively charged domains that facilitate calcium chelation (Jin and Yip 2002). Numerous studies have delved into the role of anionic salivary proteins in calculus development, however, results have been inconsistent (Castagnola et al. 2017; Jin and Yip 2002; Pateel et al. 2017). This is probably because these calcium‐regulating proteins appear to have redundancy in their function, so even if some of these proteins are present in diminished concentrations, their functions might be compensated by other salivary proteins with overlapping function. This is why in order to understand the role of salivary proteins in dental calculus it is best to study them as a whole rather than as individual proteins.
The overall calcium binding capabilities of salivary proteins as a whole could be investigated by studying the electrochemical charge of salivary proteins by gauging the zeta potential, a metric reflecting the surface charge of proteins in water (Bhattacharjee 2016). On the other hand, proteomic methods could be used to better investigate associations between specific proteins and calculus formation. Indeed, a canine study revealed a unique salivary proteome associated with the presence or absence of dental calculus in dogs (Bringel et al. 2020), hinting at similar potential correlations in humans that warrant further investigation.
This study aims to investigate the hypothesis that the electrochemical properties of saliva, specifically its overall zeta potential, and its proteomic profile are indicative of an individual's resistance to dental calculus formation. To do this, we analysed the saliva of a group of patients with a history of dental calculus formation to discern the relationship between calculus formation rates with salivary zeta potential and proteome.
2. Materials and Methods
This observational study follows the STROBE (Strengthening the Reporting of Observational Studies in Epidemiology) guidelines for transparent and comprehensive reporting of observational research. This study was approved by the Institutional Review Board (A08‐M36‐16B) at McGill University in accordance with the Helsinki Declaration. All participants of this study provided written informed consent voluntarily. Participants were recruited through advertisement at the dental hygiene clinic of CEGEP Garneau (Quebec City, Canada) between April 2017 and March 2018 (Al‐Hashedi et al. 2022). A certified hygienist oversaw the recruitment and data collection process. Inclusion criteria for participants were as follows: ≥ 18 years of age, patient compliance with study instructions and timeline; ≥ 20 intact natural teeth, including all lower anterior teeth; a history of calculus formation (at least 1.5 mm wide) on the lingual surfaces of the lower front teeth within 6–9 months after receiving a professional prophylaxis treatment, being in good general health. Exclusion criteria included: any physical, psychological or health conditions that could hinder participants' ability to brush their teeth or attend study appointments; recent use of antibiotics or anti‐inflammatory drugs within the month prior to the study; regular use of chlorhexidine oral products, presence of oral prostheses, dental implants or fixed orthodontic appliances that could increase plaque accumulation on the lower anterior teeth, sensitivity to tartar‐control toothpastes; advanced periodontitis indicated by a Periodontal Screening and Recording (PSR) scale of 4 (Landry and Jean 2002), pregnancy, and inability to return for evaluation or study recalls.
2.1. Clinical Procedures and Evaluation
At the baseline assessment, relevant demographic, dental and medical information, including sex, age, ethnicity, tooth sensitivity, diabetes, hypertension, periodontal conditions and malocclusion, were recorded. To minimise confounding factors related to calculus formation, all participants were provided with a standardised oral hygiene kit that included an off‐the‐shelf toothpaste (Complete Whitening Plus Scope, tartar control; Procter & Gamble, Cincinnati, OH, USA), a toothbrush and a dental floss. They also received detailed instructions on the modified Stillman brushing technique (Al‐Hashedi et al. 2022) and were closely monitored throughout the study to ensure adherence to these guidelines. The following clinical parameters were recorded:
The calculus build‐up on the lingual surfaces of six lower anterior teeth, measured using the Volpe‐Manhold Index (VMI) (Volpe et al. 1965).
The plaque accumulation on the labial and lingual surfaces of the teeth, evaluated using the Quigley‐Hain Plaque Index (QHI) (Turesky et al. 1970).
The condition of the gingiva, including the buccal and lingual marginal gingiva and interdental papillae of all teeth, was assessed using the Modified Gingival Index (MGI) (Lobene et al. 1986).
All patients underwent a standard dental cleaning procedure at the 3‐month mark. They were subsequently recalled every 3 months twice (month 6 and month 9) for re‐assessment of calculus formation (Figure 1). At 9 months from the baseline, or 6 months after professional cleaning, participants with a VMI score above 7 were categorised as rapid‐forming subjects, while those with a score of 7 or lower were classified as the slow‐forming subjects (Blank et al. 1994). Two experienced dental hygienists underwent training and calibration in the clinical measurement process, resulting in excellent agreement and significantly reliable results (Cohen's κ = 0.92–0.96). As an incentive at the end of the study, all participants were offered a complimentary dental cleaning free of charge.
FIGURE 1.

Study flow chart.
2.2. Saliva Collection and Preparation
Unstimulated whole saliva (UWS) samples were collected at the baseline assessment. To minimise potential influences of hunger and circadian variations on saliva composition, sample collection took place in the morning between 9 and 12 a.m. (Young et al. 1997). Participants were instructed not to eat, drink or brush their teeth for at least 1 h prior to saliva collection. Before collecting saliva, participants rinsed their mouths thoroughly with de‐ionised distilled water and waited for approximately 5 min to allow saliva to accumulate, thereby reducing the risk of sample dilution and minimising potential contamination from food debris, cigarette residue or airborne particulates.
Participants were then instructed to expectorate saliva into 15‐mL test tubes, which were promptly sealed and refrigerated at 4°C. The samples were then centrifuged at 10,000 g for 10 min to ensure the complete removal of food particles and cellular debris (Schipper et al. 2007). The resulting supernatant was carefully collected into small, sterilised Eppendorf tubes and immediately placed on dry ice and then stored at −80°C liquid nitrogen until further analyses. The concentrations of calcium and phosphorous in saliva samples were quantified using inductively coupled plasma‐optical emission spectroscopy (ICP‐OES) (Thermo Scientific iCAP 6500, Cambridge, UK) (details in Supporting Information) (Vallapragada et al. 2011). The pH value of each saliva sample was measured using a digital pH meter (Metler Toledo, OH, USA). The zeta potential of saliva samples was assessed at a temperature of 25°C using electrophoretic light scattering with a Zetasizer Nano‐ZS instrument (Malvern instrument, Version 5.0, QC, Canada) (details in Supporting Information) (Kaszuba et al. 2010). Salivary proteins were analysed using liquid chromatography–electrospray ionisation tandem mass spectrometry (LC‐ESI‐MS/MS) (Shevchenko et al. 2006). The raw data obtained from the mass spectrometer were converted into *.mgf format (Mascot generic format) for subsequent searching using the Mascot 2.5.1 search engine (Matrix Science). The searches were conducted against a database of human protein sequences (Uniprot 2020), and the expanded Human Oral Microbiome Database (eHOMD) based on 16S rRNA gene references (https://www.homd.org/) (Verma et al. 2018). The database search results were imported into Scaffold 5 (Proteome software Inc., Portland, OR, USA) for spectral counting statistical analysis and data visualisation (details in Supporting Information). Protein identifications were accepted with a probability > 99.0% and contained at least 2 identified unique peptide. Protein probabilities were assigned in Scaffold by the Protein Prophet algorithm (Nesvizhskii et al. 2003). Data for spectral counting for identified peptides was analysed using the built‐in capabilities of Scaffold 5 software. Scaffold 5 was used to filter proteins, retaining those identified in at least two out of three replicates in at least one condition. The spectral counts were processed and normalised within Scaffold 5. As Scaffold 5 handles missing values internally, no external imputation methods, such as those provided by the DEP R package, were necessary. This approach ensures the robustness and reliability of the spectral count data analysis within the specialised framework of Scaffold 5. Instead of a strict correction, we used pathway enrichment analysis as an additional filter to identify meaningful biological trends, ensuring robustness in the presence of potential false positives (Pascovici et al. 2016). Differential expression analysis was performed using standard t‐tests without corrections for multiple comparisons. Results were reported based on a p‐value cutoff of < 0.05 and a log2 fold change > log2(1.5), acknowledging the exploratory nature of this approach. While this method increases the risk of false positives, it minimises the exclusion of potentially meaningful biological patterns. GO enrichment analysis was conducted using PANTHER against Homo sapiens background with false discovery rate corrections of less than 1% for multiple testing (Burger 2023; Mi et al. 2018). It also served as an additional validation layer to identify trends. However, we emphasise that the reported p values should not be interpreted as indicators of statistical significance but rather as exploratory findings requiring further confirmation. Bioinformatic analysis involving pathway analysis, molecular function, biological processes and cellular components of proteins was presented in charts generated using the PANTHER (ProteinAnalysis Through Evolutionary Relationships; http://pantherdb.org; version 17.0) classification system (Abdallah et al. 2017; Abu Nada et al. 2018). The mass spectrometry proteomics data have been deposited to the ProteomeXchange Consortium via the PRIDE (Perez‐Riverol et al. 2022) partner repository with the dataset identifier PXD050597.
2.3. Statistical Analysis
Statistical analysis was performed using Origin 9.0 (Origin Lab, Northampton, MA, USA) and IBM SPSS Statistics 20 (IBM Corporation, Somers, NY, USA) software packages. The normality of data distribution was assessed using the one‐sample Kolmogorov–Smirnov and Shapiro–Wilk tests. For comparisons between two groups, appropriate statistical tests such as Fisher's exact test, Mann–Whitney U test, two‐way ANOVA and Pearson's correlation were employed. The level of statistical significance was set at a p value of less than 0.05. Proteomic, and metaproteomic analysis was performed based on established protocols (details in Supporting Information).
3. Results
A total of 31 participants were recruited but 5 dropped out later, leading to 26 participants included in the study, 3 men (11.5%) and 23 women (88.5%), with a mean age of 37.3 ± 14.5 years. Participants were divided according to their VMI score after the 6‐month post‐scaling follow‐up, into two groups a rapid calculus‐forming group (rapid group, n = 11) and a slow calculus‐forming group (slow group, n = 15). There was no significant difference between the two groups in terms of demographic, medical and oral health characteristics (p > 0.05) (Table S1).
3.1. Physical–Chemical Characteristics of Saliva
Chemical and electrochemical characterisation of saliva showed no significant differences between the two groups in terms of pH as well as protein and phosphorous concentration. However, slow calculus formers presented a significantly more negative zeta potential and higher calcium concentration than rapid formers (Table 1). Also, the VMI score had a significant direct correlation with the zeta potential (r = 0.47), but not with calcium concentration. Meanwhile, there was a positive correlation between protein and phosphorous concentration (r = 0.46) (Details in Tables S2 and S3).
TABLE 1.
Comparison of biochemical analysis results between two groups.
| Calculus formation | p value (Mann–Whitney U) | ||||
|---|---|---|---|---|---|
| Rapid | Slow | ||||
| Mean (SD) | [Max, min] | Mean (SD) | [Max, min] | ||
| Zeta potential | −21.69 (3.69) | [−16.06, −25.46] | −26.29 ((4.38) | [−19.90, −27.93] | 0.009** |
| pH | 6.95 (0.32) | [7.73, 6.55] | 6.71 (0.41) | [7.43, 5.99] | 0.143 |
| Calcium (μg/mL) | 11.33 (3.30) | [20.26, 8.1] | 14.17 (4.39) | [23.18, 4.83] | 0.04* |
| Phosphorous (μg/mL) | 185.18 (45.61) | [255.88, 95.45] | 178.97 (51.06) | [291.86, 121.80] | 0.517 |
| Protein (μg/mL) | 1626.29 (649.24) | [3029.70, 867.28] | 1220.59 (229.0) | [1586.22, 780.60] | 0.495 |
Note: *p < 0.5, **p < 0.001.
3.2. Proteomic Analysis of Salivary Proteins
A total of 895 proteins were identified and quantified in the saliva samples. A comparative analysis of the overlapping proteins, based on total spectrum count (t‐test, p < 0.05), was shown in a Venn diagram (Figure 2A). Most of the identified proteins (833, 93.1%) were commonly present in both groups; however, 38 proteins (4.2%) showed higher concentrations in the rapid group and 24 (2.7%) were abundant in the slow group. The differential protein expression between rapid and slow dental calculus formers, with up‐regulated proteins indicated in green and red, is visualised in a volcano plot (Figure S1). Exclusive proteins identified by 99% probability in each group were listed in the (Tables S4 and S5).
FIGURE 2.

(A) Venn diagram showing salivary proteins uniquely expressed with statistical significance in rapid and slow group or commonly expressed in both groups; (B) and (C) Gene Ontology (GO) enrichment analysis of cellular components, molecular functions, and biological processes for up‐regulated proteins in the rapid and slow groups. The number of proteins for respective terms is shown on the x‐axis.
The highest enrichment for Gene‐Ontology Biological Process (GOBP) in the rapid group revealed negative regulation of endopeptidase activity (n = 9/246), hyaluronan metabolic process (n = 3/23) and regulation of L‐arginine import across plasma membrane (n = 2/2), while enrichment for Gene‐Ontology Molecular Function (GOMF) revealed glycosaminoglycan binding (n = 5/241), serine‐type endopeptidase inhibitor activity (n = 7/101) and fructose‐bisphosphate aldolase activity (n = 2/3) (Figure 2B). In contrast, the highest enrichment for GOBP in the slow group revealed innate immune response (n = 8/827) and positive regulation of B cell activation (n = 7/170), while enrichment for GOMF revealed antigen binding (n = 8/193) and immunoglobulin receptor binding (n = 8/97) (Figure 2C). Visualisation of the STRING protein–protein interaction revealed 38 nodes and 106 edges on the proteins exclusively detected in the saliva of the rapid group, whereas 14 nodes and 10 edges were shown for saliva in the slow group (Figure S2).
Panther Pathway analysis showed that compared with the slow group, the rapid group overexpressed proteins related to cell binding (cytoskeletal regulation by Rho GTPase and integrin signalling pathway), inflammatory mediation (chemokine and cytokine signalling pathways), neurodegenerative disorders (Alzheimer's disease‐presenilin pathway, Huntington's disease and Parkinson's disease) and glycolytic metabolism (Fructose galactose metabolism, Glycolysis, Pyruvate metabolism, Pentose phosphate pathway) (Figure 3).
FIGURE 3.

Enrichment analysis of the Gene Ontology terms arising from proteins in both groups. Bar chart illustrating the distribution of the enriched pathways obtained from PANTHER. The value of −log10 (Fisher's test p value) is shown.
3.3. Salivary Metaproteomic and Taxonomic Analysis
A total of 670 catalogued bacterial proteins were identified in the salivary samples, 599 of them (89.4%) were found in both groups, 70 (10.4%) were only found in the rapid group and one protein was only found in the slow group (0.1%) (Table S6). Phylogenetic distribution across both groups, as visualised in the heat tree (Figure 4A), unveiled the presence of seven bacterial phyla: Actinobacteria, Bacteriodetes, Firmicutes, Fusobacteria, Spitochaetes, Chlorobi and Proteobacteria. Statistical analysis highlighted a significant predominance of the phyla Firmicutes, especially the genus Streptococcus, in the rapid group, and the genus Rothia in the slow group (Figure 4B). The complete proteomic and meta‐proteomic datasets are available in (Table S7).
FIGURE 4.
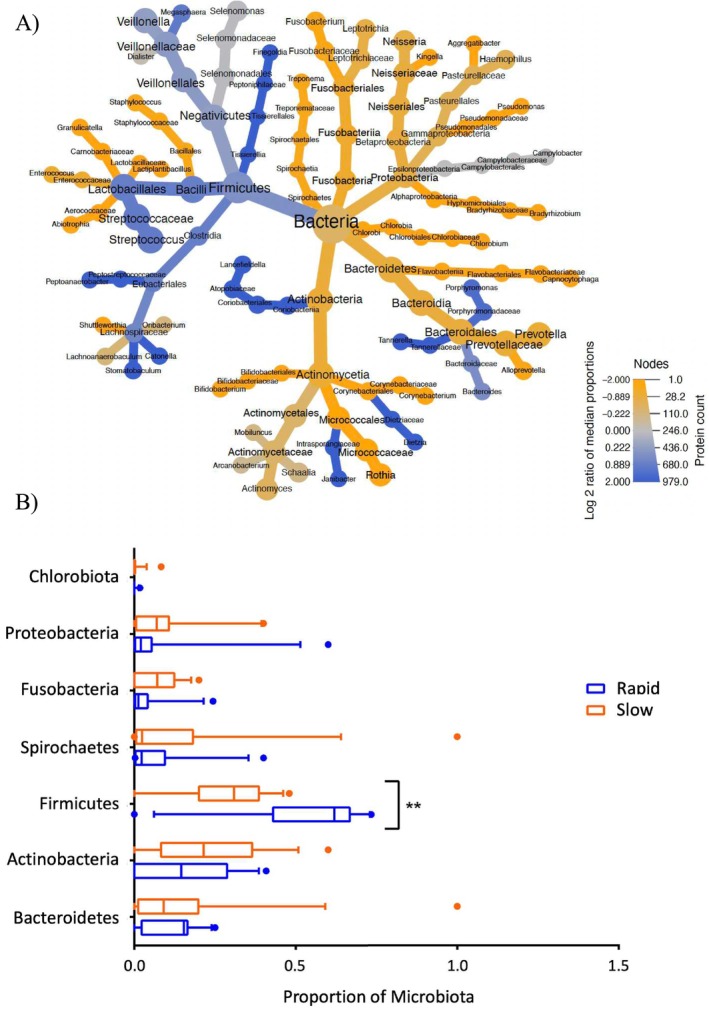
(A) Heat tree analysis utilises a hierarchical structure of taxonomic disparities. Quantitative evaluation of these differences is achieved using the log2 transformed ratio of median proportions, visualised through colour intensity. The total protein spectra counts dictate the branch size and node. Blue branches imply a higher bacterial expression in the rapid group whereas yellow branches signify the converse. (B) The bar plot depicts the differential abundance of phyla between the two groups, as assessed by two‐way ANOVA with multiple comparisons. Notably, a substantial up‐regulation of Firmicutes was observed in the rapid group.
4. Discussion
Our study showed that the saliva of rapid calculus‐forming patients differs from that of slow‐forming patients in terms of elemental, electrochemical, proteomic and metaproteomic characteristics. These differences were most obvious for salivary zeta potential, calcium concentration, proteome and bacterial metaproteome.
Our results showed that salivary zeta potential was more negative in the slow group, suggesting a possible correlation between calculus formation and this parameter. The Zeta potential is an indicator of the overall electrical charges of particles (e.g., proteins) in suspensions (e.g., saliva). Thus, our findings suggest that salivary negative charges could be playing a role in preventing calculus formation, probably because negatively charged proteins can chelate calcium ions, thus increasing their solubility and inhibiting their precipitation. Moreover, repulsive interactions with negatively charged surfaces of the oral cavity (i.e., teeth and salivary pellicle) could prevent adherence and colonisation of bacteria and dental plaque (Selvamani 2019), thereby preventing calculus formation. Interestingly, salivary proteomic analysis revealed that slow calculus‐forming patients had higher concentrations of the negatively charged protein mucin MUC5B (Mendes et al. 2018). Thus, it could be speculated that the association between salivary zeta potential and calculus formation rate could be traced to differences in this protein, although future studies would be needed to investigate this hypothesis.
Calcium precipitation is a key feature of dental calculus formation. However, we found that individuals with slower calculus formation had higher concentrations of calcium in saliva. This counterintuitive observation suggests that calculus deposition is more likely to depend on the solubility rather than the concentration of calcium in saliva. As described above, slow calculus‐forming patients had higher concentrations of negatively charged molecules, and this can increase calcium solubility. Indeed negatively charged salivary proteins are known to bind calcium ions in saliva, and thus prevent their deposition on tooth surfaces (Pateel et al. 2017). This is probably why patients with a more negative salivary zeta potential had slower calculus formation despite having higher concentrations of calcium. However, further investigations are essential to better understand these interconnections.
Our approach, which omits corrections for multiple comparisons, reflects the exploratory focus of this study and acknowledges the trade‐off between identifying potential true positives and controlling false positives. To address this, we rely on pathway enrichment analysis to identify biologically meaningful patterns. Nevertheless, we avoid referring to our findings as statistically significant. Instead, they are meeting a predefined p‐value cutoff at 0.05. Future studies with larger sample sizes and stricter statistical corrections will be necessary to validate these findings.
Salivary proteomic analysis revealed several pathways associated with calculus formation rate. One example was proteins linked to ‘serine‐type endopeptidase inhibitor activity’. These inflammatory pathways are known to surge in gingivitis and wane in advanced periodontitis (Afacan et al. 2022), thus their upregulation may indicate an attempt to counterbalance the inflammatory processes associated with calculus formation. The rapid group also showed upregulation of the ‘hyaluronan metabolic process’ and ‘glycosaminoglycan binding’, which are known to bolster the reparative potential of saliva, and are implicated in dental calculus formation (Pogrel et al. 1996).
In contrast, the slow group presented upregulation of proteins related to immunomodulation, such as those involved in the ‘innate immune response’, ‘positive regulation of B cell activation’, ‘antigen binding’ and ‘immunoglobulin receptor binding’. These proteins are quintessential for oral health because they prevent adherence, colonisation and penetration of pathogens into the oral mucosa (Cekici et al. 2014).
Panther's analysis also revealed the expression of certain pathways correlated with calculus deposition rates (Tables S8 and S9). For example, the rapid group displayed increased expression of cell binding and cytoskeletal regulation pathways, including the Rho GTPase and integrin signalling pathways. These pathways underpin cellular processes, like adhesion, migration and cytoskeletal organisation, and have been implicated in modulating the effects of TGFβ‐1 (Giancotti 2003). This cytokine, which is known to play a role in periodontal diseases (Lee et al. 2008) and periodontal tissues through Rho GTPase‐dependent pathways (Wang et al. 2014), was also observed to be overexpressed in the saliva of dogs with pronounced dental calculus (Bringel et al. 2020). The rapid group also showed overexpression of inflammatory pathways, which is consistent with the well‐stablished link between salivary cytokines with dental plaque and periodontal diseases (Kurgan and Kantarci 2018; Tang et al. 2023). Our analysis of the rapid group also revealed overexpression of pathways related to neurodegenerative diseases such as Alzheimer's disease, Huntington's disease and Parkinson's disease. This observation is in agreement with the established literature on the nexus between periodontitis and these conditions (Alvarenga et al. 2021). Additionally, pathways related to carbohydrate processing such as the glycolysis, fructose‐galactose, pyruvate and pentose phosphate pathways were up‐regulated in the rapid group (Chandel 2021). Surplus carbohydrates in the oral environment foster conditions favourable to pathogenic bacteria associated with oral diseases (Moye et al. 2014). Thus, the metabolic up‐regulation identified in the rapid group might reflect specific metabolic shifts related to calculus formation.
Metaproteomic analysis revealed differences in the microbiome of both groups. At the phylum level, the rapid group exhibited increased concentrations of Streptococcus spp. A group of early colonising bacteria that play a pivotal role in dental plaque formation and have been implicated in dental calculus development (Baris et al. 2017). Surprisingly, notorious periodontopathogens like Aggregatibacter actinomycetemcomitans , Porphyromonas gingivalis and Fusobacterium nucleatum were not associated with calculus formation (Karaaslan et al. 2020). Interestingly, the genus Rothia spp. was exclusively present in the slow group. Rothia spp., are conventional residents of the oral environment and are frequently observed in individuals devoid of oral disease (Stephen et al. 2021). These bacteria can convert salivary nitrate to nitrite and nitric oxide (Mashimo et al. 2015), an effective antimicrobial agent that could curb plaque accumulation and mitigate gingival inflammation (Rosier et al. 2018).
The findings of this study contribute to a better understanding of the underlying mechanisms of dental calculus formation and potential biomarkers and therapeutic targets for diagnosis, prevention and management of pathological dental calcifications and related oral health issues such as gingivitis and periodontitis. However, our study has some important limitations that need to be considered. One limitation of our study is the imbalance in male to female ratio in our cohort. Most of our volunteers were females, and this imbalance could impact the generalizability of the findings. Therefore, further studies with a more balanced gender ratio and a larger sample size would be beneficial to confirm the findings and enhance the applicability. Nonetheless, as shown in Table S1, there was no significant difference regarding the gender distribution in rapid and slow groups (p = 0.56). This means that the findings observed in our study remain valid despite the large number of females in the population. In addition, the p value cut‐off of 0.05 was used for the proteomics differential expression analysis. Due to the exploratory focus of our study, we justify a more lenient threshold to ensure potentially significant findings are not prematurely dismissed. Moreover, our study identified several bacteria, proteins, and signalling and metabolic pathways that seem to be associated with calculus formation. However, the proteomic analysis used has limitations in terms of detecting and quantifying proteins, thus future studies specifically designed to analyse the candidates identified would be needed to further confirm our findings. Another major impediment in calculus research pertains to the wide range of potential confounding factors such as variations in patient demographics, medical history, oral hygiene and the presence of pre‐existing calculus deposits. To address this, our cohort study ensured participants received standard oral hygiene guidelines and kits, and a complete dental cleaning at study entry. This strength in our study allowed us to precisely monitor the calculus growth in a controlled set‐up. Moreover, analysis of patient history revealed no significant differences between groups in terms of age, sex, diabetes, hypertension, periodontitis or ethnicity, suggesting negligible confounding influences from these variables. Participant oral hygiene was closely monitored and controlled by clinical indices at different time points, such as the Volpe‐Manhold Index and Modified Gingival Index. The validity of our oral hygiene standardisation was confirmed by the fact that no significant difference was observed between our groups in terms of gingival indices and plaque indices (Table S10). Existing literature provides limited evidence on how standardised oral hygiene might affect saliva zeta potential, elemental composition, or the proteome and metaproteome (Belstrøm et al. 2018; Huang et al. 2021; Justino et al. 2017), suggesting these factors are largely independent. However, it is still possible that individual variations in oral hygiene adherence or response to the standardised protocols influenced the results. This highlights the importance of considering oral hygiene as a variable that might interact with other factors influencing calculus formation. Lastly, the decision to omit missing value imputation was made to minimise artificial biases. However, this approach may have contributed to edge effects, particularly for low‐abundance bacterial taxa, potentially exaggerating fold changes. Future studies should explore robust imputation or filtering strategies to address these limitations.
Despite the established roles of salivary proteins such as cystatins and proline‐rich proteins in calcium and phosphate homeostasis, no significant differences in their expression were observed between the two groups. This may suggest that these proteins are not critically involved in calculus formation, as initially hypothesized. Alternatively, the lack of significant variation may be attributed to the functional redundancy among salivary proteins, where physiological functions are often mediated by a network of proteins with shared functional groups, rather than being reliant on the activity of a single protein.
5. Conclusion
This study shows how calculus formation rate could be associated with various characteristics of saliva such as zeta potential, mineral composition, proteome and bacterial metaproteome. In depth, proteomic analysis revealed several metabolic and signalling pathways, and bacteria in saliva, which seem to be associated with calculus formation.
Author Contributions
Wenji Cai contributed to the conception, design, acquisition, analysis and interpretation of the study, drafted the manuscript and critically revised it. Nadia Dubreuil contributed to the design, acquisition, and analysis and critically revised the manuscript. Lina Abu‐Nada contributed to data analysis and interpretation, drafted the manuscript, and critically revised it. Wen Bo Sam Zhou contributed to data analysis and interpretation and critically revised the manuscript. Tayebeh Basiri contributed to data acquisition and analysis and critically revised the manuscript. Amir Hadad contributed to data acquisition and analysis and critically revised the manuscript. Priti Charde contributed to data interpretation, drafted the manuscript and critically revised it. Maxime Ducret contributed to the conception, design, acquisition, analysis and interpretation of the study, drafted the manuscript and critically revised it. Faleh Tamimi contributed to the conception, design, acquisition, analysis, and interpretation of the study, drafted the manuscript, and critically revised it. All authors gave their final approval and agreed to be accountable for all aspects of the work.
Conflicts of Interest
The authors declare no conflicts of interest.
Supporting information
Data S1.
Table S7.
Acknowledgements
We acknowledge the following funding agencies for supporting this research study: MEDTEQ, MITACS and Visionaturolab Inc. We also acknowledge the services of the RIMUHC Clinical Proteomics Platform for its support in the proteomics analysis.
Funding: This work was supported by Mitacs, Visionaturolab Inc and MEDTEQ+.
Data Availability Statement
The data that support the findings of this study are available in the Supporting Information of this article.
References
- Abdallah, M. N. , Tran S. D., Abughanam G., et al. 2017. “Biomaterial Surface Proteomic Signature Determines Interaction With Epithelial Cells.” Acta Biomaterialia 54: 150–163. 10.1016/j.actbio.2017.02.044. [DOI] [PubMed] [Google Scholar]
- Abu Nada, L. , Al Subaie A., Mansour A., et al. 2018. “The Antidepressant Drug, Sertraline, Hinders Bone Healing and Osseointegration in Rats' Tibiae.” Journal of Clinical Periodontology 45, no. 12: 1485–1497. 10.1111/jcpe.13015. [DOI] [PubMed] [Google Scholar]
- Afacan, B. , Öztürk V. Ö., Emingil G., Köse T., Mitsakakis K., and Bostanci N.. 2022. “Salivary Secretory Leukocyte Protease Inhibitor Levels in Patients With Stage 3 Grade C Periodontitis: A Comparative Cross‐Sectional Study.” Scientific Reports 12, no. 1: 21267. 10.1038/s41598-022-24295-2. [DOI] [PMC free article] [PubMed] [Google Scholar]
- Akcalı, A. , and Lang N. P.. 2018. “Dental Calculus: The Calcified Biofilm and Its Role in Disease Development.” Periodontology 2000 76, no. 1: 109–115. 10.1111/prd.12151. [DOI] [PubMed] [Google Scholar]
- Al‐Hashedi, A. A. , Dubreuil N., Schwinghamer T., et al. 2022. “Aragonite Toothpaste for Management of Dental Calculus: A Double‐Blinded Randomized Controlled Clinical Trial.” Clinical and Experimental Dental Research 8, no. 4: 863–874. 10.1002/cre2.559. [DOI] [PMC free article] [PubMed] [Google Scholar]
- Alvarenga, M. O. P. , Frazão D. R., de Matos I. G., et al. 2021. “Is There Any Association Between Neurodegenerative Diseases and Periodontitis? A Systematic Review.” Frontiers in Aging Neuroscience 13: 651437. 10.3389/fnagi.2021.651437. [DOI] [PMC free article] [PubMed] [Google Scholar]
- Baris, O. , Demir T., and Gulluce M.. 2017. “Investigation of In Vitro Mineral Forming Bacterial Isolates From Supragingival Calculus.” Nigerian Journal of Clinical Practice 20, no. 12: 1571–1575. 10.4103/1119-3077.187316. [DOI] [PubMed] [Google Scholar]
- Belstrøm, D. , Sembler‐Møller M. L., Grande M. A., et al. 2018. “Impact of Oral Hygiene Discontinuation on Supragingival and Salivary Microbiomes.” JDR Clinical and Translational Research 3, no. 1: 57–64. 10.1177/2380084417723625. [DOI] [PMC free article] [PubMed] [Google Scholar]
- Bhattacharjee, S. 2016. “DLS and Zeta Potential – What They Are and What They Are Not?” Journal of Controlled Release 235: 337–351. 10.1016/j.jconrel.2016.06.017. [DOI] [PubMed] [Google Scholar]
- Blank, L. W. , Rule J. T., Colangelo G. A., Copelan N. S., and Perlich M. A.. 1994. “The Relationship Between First Presentation and Subsequent Observations in Heavy Calculus Formers.” Journal of Periodontology 65, no. 8: 750–754. 10.1902/jop.1994.65.8.750. [DOI] [PubMed] [Google Scholar]
- Bringel, M. , Jorge P. K., Francisco P. A., et al. 2020. “Salivary Proteomic Profile of Dogs With and Without Dental Calculus.” BMC Veterinary Research 16, no. 1: 298. 10.1186/s12917-020-02514-0. [DOI] [PMC free article] [PubMed] [Google Scholar]
- Burger, T. 2023. “Controlling for False Discoveries Subsequently to Large Scale One‐Way ANOVA Testing in Proteomics: Practical Considerations.” Proteomics 23, no. 18: 2200406. 10.1002/pmic.202200406. [DOI] [PubMed] [Google Scholar]
- Castagnola, M. , Scarano E., Passali G. C., et al. 2017. “Salivary Biomarkers and Proteomics: Future Diagnostic and Clinical Utilities.” Acta Otorhinolaryngologica Italica 37, no. 2: 94–101. 10.14639/0392-100x-1598. [DOI] [PMC free article] [PubMed] [Google Scholar]
- Cekici, A. , Kantarci A., Hasturk H., and Van Dyke T. E.. 2014. “Inflammatory and Immune Pathways in the Pathogenesis of Periodontal Disease.” Periodontology 2000 64, no. 1: 57–80. 10.1111/prd.12002. [DOI] [PMC free article] [PubMed] [Google Scholar]
- Chandel, N. S. 2021. “Carbohydrate Metabolism.” Cold Spring Harbor Perspectives in Biology 13, no. 1: a040568. 10.1101/cshperspect.a040568. [DOI] [PMC free article] [PubMed] [Google Scholar]
- D'Souza, L. , Lawande S. A., Samuel J., and Wiseman Pinto M. J.. 2023. “Effect of Salivary UREA, pH and Ureolytic Microflora on Dental Calculus Formation and Its Correlation With Periodontal Status.” Journal of Oral Biology and Craniofacial Research 13, no. 1: 8–12. 10.1016/j.jobcr.2022.10.004. [DOI] [PMC free article] [PubMed] [Google Scholar]
- Fons‐Badal, C. , Fons‐Font A., Labaig‐Rueda C., Fernanda Solá‐Ruiz M., Selva‐Otaolaurruchi E., and Agustín‐Panadero R.. 2020. “Analysis of Predisposing Factors for Rapid Dental Calculus Formation.” Journal of Clinical Medicine 9, no. 3: 858. 10.3390/jcm9030858. [DOI] [PMC free article] [PubMed] [Google Scholar]
- Forshaw, R. 2022. “Dental Calculus – Oral Health, Forensic Studies and Archaeology: A Review.” British Dental Journal 233, no. 11: 961–967. 10.1038/s41415-022-5266-7. [DOI] [PMC free article] [PubMed] [Google Scholar]
- Giancotti, F. G. 2003. “A Structural View of Integrin Activation and Signaling.” Developmental Cell 4, no. 2: 149–151. 10.1016/s1534-5807(03)00034-0. [DOI] [PubMed] [Google Scholar]
- Hidaka, S. , and Oishi A.. 2007. “An In Vitro Study of the Effect of Some Dietary Components on Calculus Formation: Regulation of Calcium Phosphate Precipitation.” Oral Diseases 13, no. 3: 296–302. 10.1111/j.1601-0825.2006.01283.x. [DOI] [PubMed] [Google Scholar]
- Huang, S. , He T., Yue F., et al. 2021. “Longitudinal Multi‐Omics and Microbiome Meta‐Analysis Identify an Asymptomatic Gingival State That Links Gingivitis, Periodontitis, and Aging.” MBio 12, no. 2: e03281‐20. 10.1128/mbio.03281-20. [DOI] [PMC free article] [PubMed] [Google Scholar]
- Humphrey, S. P. , and Williamson R. T.. 2001. “A Review of Saliva: Normal Composition, Flow, and Function.” Journal of Prosthetic Dentistry 85, no. 2: 162–169. 10.1067/mpr.2001.113778. [DOI] [PubMed] [Google Scholar]
- Jin, Y. , and Yip H. K.. 2002. “Supragingival Calculus: Formation and Control.” Critical Reviews in Oral Biology and Medicine 13, no. 5: 426–441. 10.1177/154411130201300506. [DOI] [PubMed] [Google Scholar]
- Justino, A. B. , Teixeira R. R., Peixoto L. G., Jaramillo O. L. B., and Espindola F. S.. 2017. “Effect of Saliva Collection Methods and Oral Hygiene on Salivary Biomarkers.” Scandinavian Journal of Clinical and Laboratory Investigation 77, no. 6: 415–422. 10.1080/00365513.2017.1334261. [DOI] [PubMed] [Google Scholar]
- Karaaslan, F. , Demir T., and Barış O.. 2020. “Effect of Periodontal Disease‐Associated Bacteria on the Formation of Dental Calculus: An In Vitro Study.” Journal of Advanced Oral Research 11, no. 2: 165–171. 10.1177/2320206820919591. [DOI] [Google Scholar]
- Kaszuba, M. , Corbett J., Watson F. M., and Jones A.. 2010. “High‐Concentration Zeta Potential Measurements Using Light‐Scattering Techniques.” Philosophical Transactions. Series A, Mathematical, Physical, and Engineering Sciences 368, no. 1927: 4439–4451. 10.1098/rsta.2010.0175. [DOI] [PMC free article] [PubMed] [Google Scholar]
- Kurgan, S. , and Kantarci A.. 2018. “Molecular Basis for Immunohistochemical and Inflammatory Changes During Progression of Gingivitis to Periodontitis.” Periodontology 2000 76, no. 1: 51–67. 10.1111/prd.12146. [DOI] [PubMed] [Google Scholar]
- Landry, R. G. , and Jean M.. 2002. “Periodontal Screening and Recording (PSR) Index: Precursors, Utility and Limitations in a Clinical Setting.” International Dental Journal 52, no. 1: 35–40. 10.1111/j.1875-595x.2002.tb00595.x. [DOI] [PubMed] [Google Scholar]
- Lee, J. , Ko M., and Joo C. K.. 2008. “Rho Plays a Key Role in TGF‐Beta1‐Induced Cytoskeletal Rearrangement in Human Retinal Pigment Epithelium.” Journal of Cellular Physiology 216, no. 2: 520–526. 10.1002/jcp.21424. [DOI] [PubMed] [Google Scholar]
- Lobene, R. R. , Weatherford T., Ross N. M., Lamm R. A., and Menaker L.. 1986. “A Modified Gingival Index for Use in Clinical Trials.” Clinical Preventive Dentistry 8, no. 1: 3–6. [PubMed] [Google Scholar]
- Martins, C. , Siqueira W. L., Oliveira E., Nicolau J., and Primo L. G.. 2012. “Dental Calculus Formation in Children and Adolescents Undergoing Hemodialysis.” Pediatric Nephrology 27, no. 10: 1961–1966. 10.1007/s00467-012-2194-9. [DOI] [PubMed] [Google Scholar]
- Mashimo, C. , Tsuzukibashi O., Uchibori S., and Nambu T.. 2015. “Variations of Nitrate‐Reducing Activity in Oral Rothia Mucilaginosa.” Journal of Oral Tissue Engineering 13, no. 1: 18–26. 10.11223/jarde.13.18. [DOI] [Google Scholar]
- Mendes, A. C. , Sevilla Moreno J., Hanif M., Douglas T. E. L., Chen M., and Chronakis I. S.. 2018. “Morphological, Mechanical and Mucoadhesive Properties of Electrospun Chitosan/Phospholipid Hybrid Nanofibers.” International Journal of Molecular Sciences 19, no. 8: 2266. 10.3390/ijms19082266. [DOI] [PMC free article] [PubMed] [Google Scholar]
- Mi, H. , Muruganujan A., Ebert D., Huang X., and Thomas P. D.. 2018. “PANTHER Version 14: More Genomes, a New PANTHER GO‐Slim and Improvements in Enrichment Analysis Tools.” Nucleic Acids Research 47, no. D1: D419–D426. 10.1093/nar/gky1038. [DOI] [PMC free article] [PubMed] [Google Scholar]
- Moye, Z. D. , Zeng L., and Burne R. A.. 2014. “Fueling the Caries Process: Carbohydrate Metabolism and Gene Regulation by Streptococcus mutans .” Journal of Oral Microbiology 6, no. 1: 24878. 10.3402/jom.v6.24878. [DOI] [PMC free article] [PubMed] [Google Scholar]
- Nesvizhskii, A. I. , Keller A., Kolker E., and Aebersold R.. 2003. “A Statistical Model for Identifying Proteins by Tandem Mass Spectrometry.” Analytical Chemistry 75, no. 17: 4646–4658. [DOI] [PubMed] [Google Scholar]
- Pascovici, D. , Handler D. C., Wu J. X., and Haynes P. A.. 2016. “Multiple Testing Corrections in Quantitative Proteomics: A Useful but Blunt Tool.” Proteomics 16, no. 18: 2448–2453. 10.1002/pmic.201600044. [DOI] [PubMed] [Google Scholar]
- Pateel, D. G. S. , Gunjal S., Math S. Y., Murugeshappa D. G., and Nair S. M.. 2017. “Correlation of Salivary Statherin and Calcium Levels With Dental Calculus Formation: A Preliminary Study.” International Journal of Dentistry 2017: 2857629. 10.1155/2017/2857629. [DOI] [PMC free article] [PubMed] [Google Scholar]
- Perez‐Riverol, Y. , Bai J., Bandla C., et al. 2022. “The PRIDE Database Resources in 2022: A Hub for Mass Spectrometry‐Based Proteomics Evidences.” Nucleic Acids Research 50, no. D1: D543–d552. 10.1093/nar/gkab1038. [DOI] [PMC free article] [PubMed] [Google Scholar]
- Pogrel, M. A. , Lowe M.‐A., and Stern R.. 1996. “Hyaluronan (Hyaluronic Acid) in Human Saliva.” Archives of Oral Biology 41, no. 7: 667–671. 10.1016/S0003-9969(96)00050-7. [DOI] [PubMed] [Google Scholar]
- Rajesh, K. S. , Zareena, Hegde S., and Arun Kumar M. S.. 2015. “Assessment of Salivary Calcium, Phosphate, Magnesium, pH, and Flow Rate in Healthy Subjects, Periodontitis, and Dental Caries.” Contemporary Clinical Dentistry 6, no. 4: 461–465. 10.4103/0976-237x.169846. [DOI] [PMC free article] [PubMed] [Google Scholar]
- Rosier, B. T. , Marsh P. D., and Mira A.. 2018. “Resilience of the Oral Microbiota in Health: Mechanisms That Prevent Dysbiosis.” Journal of Dental Research 97, no. 4: 371–380. 10.1177/0022034517742139. [DOI] [PubMed] [Google Scholar]
- Schipper, R. G. , Silletti E., and Vingerhoeds M. H.. 2007. “Saliva as Research Material: Biochemical, Physicochemical and Practical Aspects.” Archives of Oral Biology 52, no. 12: 1114–1135. 10.1016/j.archoralbio.2007.06.009. [DOI] [PubMed] [Google Scholar]
- Selvamani, V. 2019. “Chapter 15 – Stability Studies on Nanomaterials Used in Drugs.” In Characterization and Biology of Nanomaterials for Drug Delivery, edited by Mohapatra S. S., Ranjan S., Dasgupta N., Mishra R. K., and Thomas S., 425–444. Elsevier. 10.1016/B978-0-12-814031-4.00015-5. [DOI] [Google Scholar]
- Shevchenko, A. , Tomas H., Havlis J., Olsen J. V., and Mann M.. 2006. “In‐Gel Digestion for Mass Spectrometric Characterization of Proteins and Proteomes.” Nature Protocols 1, no. 6: 2856–2860. 10.1038/nprot.2006.468. [DOI] [PubMed] [Google Scholar]
- Stephen, A. S. , Dhadwal N., Nagala V., et al. 2021. “Interdental and Subgingival Microbiota May Affect the Tongue Microbial Ecology and Oral Malodour in Health, Gingivitis and Periodontitis.” Journal of Periodontal Research 56, no. 6: 1174–1184. 10.1111/jre.12931. [DOI] [PubMed] [Google Scholar]
- Tang, V. , Hamidi B., Janal M. N., et al. 2023. “Periodontal Inflamed Surface Area (PISA) Associates With Composites of Salivary Cytokines.” PLoS One 18, no. 2: e0280333. 10.1371/journal.pone.0280333. [DOI] [PMC free article] [PubMed] [Google Scholar]
- Turesky, S. , Gilmore N. D., and Glickman I.. 1970. “Reduced Plaque Formation by the Chloromethyl Analogue of Victamine C.” Journal of Periodontology 41, no. 1: 41–43. 10.1902/jop.1970.41.41.41. [DOI] [PubMed] [Google Scholar]
- Vallapragada, V. V. , Inti G., and Ramulu J. S.. 2011. “A Validated Inductively Coupled Plasma‐Optical Emission Spectrometry (ICP‐OES) Method to Estimate Free Calcium and Phosphorus in In Vitro Phosphate Binding Study of Eliphos Tablets.” American Journal of Analytical Chemistry 2, no. 6: 718–725. 10.4236/ajac.2011.26082. [DOI] [Google Scholar]
- Verma, D. , Garg P. K., and Dubey A. K.. 2018. “Insights Into the Human Oral Microbiome.” Archives of Microbiology 200, no. 4: 525–540. 10.1007/s00203-018-1505-3. [DOI] [PubMed] [Google Scholar]
- Volpe, A. R. , Manhold J. H., and Hazen S. P.. 1965. “In Vivo Calculus Assessment. I. A Method and Its Examiner Reproducibility.” Journal of Periodontology 36: 292–298. 10.1902/jop.1965.36.4.292. [DOI] [PubMed] [Google Scholar]
- Wang, L. , Wang T., Song M., and Pan J.. 2014. “Rho Plays a Key ROLE in TGF‐β1‐Induced Proliferation and Cytoskeleton Rearrangement of Human Periodontal Ligament Cells.” Archives of Oral Biology 59, no. 2: 149–157. 10.1016/j.archoralbio.2013.11.004. [DOI] [PubMed] [Google Scholar]
- Young, A. , Smistad G., Karlsen J., Rölla G., and Rykke M.. 1997. “Zeta Potentials of Human Enamel and Hydroxyapatite as Measured by the Coulter DELSA 440.” Advances in Dental Research 11, no. 4: 560–565. 10.1177/08959374970110042501. [DOI] [PubMed] [Google Scholar]
Associated Data
This section collects any data citations, data availability statements, or supplementary materials included in this article.
Supplementary Materials
Data S1.
Table S7.
Data Availability Statement
The data that support the findings of this study are available in the Supporting Information of this article.