



Abstract
Background
Tamarind (Tamarindus indica L.; Fabaceae) a unique tree is valued not only for its fruits and timber but also for its shade, making it a popular avenue tree. It thrives in diverse climates and soils, particularly in semiarid regions, due to its deep root system, making it valuable in areas prone to water scarcity and high temperatures. It is now extensively grown in subtropical and semi-arid tropical regions of the world particularly common in India, Africa, and Southeast Asia. In this study, the morpho-physico-chemical variations of 30 tamarind genotypes were evaluated using multivariate analysis based on 28 variables which is essential for tree improvement.
Results
This study characterizes a collection of 30 tamarind genotypes based on a range of qualitative and quantitative traits to assess phenotypic diversity. The analysis revealed wide variation across most of the traits, indicating their potential for distinguishing germplasm diversity. High phenotypic coefficient of variation (PCV) and genotypic coefficient of variation (GCV) were observed for tree height (24.34 and 21.26), stem girth (26.63 and 23.72), tree spread E-W (23.50 and 21.68), tree spread N-S (27.46 and 24.38), pod yield kg/tree (29.98 and 27.56), pod length (25.29 and 24.51), pod breadth (22.08 and 21.92), pulp weight (30.49 and 28.58), and pod weight 31.03 and 29.74), which indicates these traits display high variation, suggesting significant potential for selection. High heritability coupled with high genetic advance were observed for the most of traits which were influenced by additive or fixable genetic variation. Path coefficient analysis revealed that traits, such as stem girth and tree spread showed direct effects on pod yield, while other characters contributed indirectly. Principal component analysis (PCA) indicated that PC-1 accounted for approximately 27.648% of the total variance, followed by PC-2 (18.250%), and PC-3 (15.835%), and hierarchical clustering uncovered crucial genetic components and distinct clusters, which can be considered for targeted breeding strategies. Cluster II emerged as the most divergent cluster, due to its the highest inter-cluster distances with other clusters and the highest intra-cluster distance.
Conclusions
The results demonstrate how varied germplasm might be used to improve tamarind cultivars. To overcome heterogeneity in desired features, a complete collection of 28 morphological descriptors is provided to characterize, evaluate, and identify tamarind genotypes. The results underscore the importance of phenotypic diversity for developing core collections with enhanced variability and for designing targeted tamarind tree breeding strategies. This study provides valuable insights for the improvement and conservation of tamarind germplasm, a valuable species with considerable potential for fruit production and other economic uses.
Clinical trial study
Not applicable.
Clinical trial number
Not applicable.
Supplementary Information
The online version contains supplementary material available at 10.1186/s12870-025-06415-y.
Keywords: Genetic variability, Morphological descriptors, Nutritional quality, Tree improvement
Introduction
Tamarind (Tamarindus indica L.) is a unique tree species of the Fabaceae family within the subfamily Caesalpiniaceae and has a chromosome number of 2n = 24 [42]. The term “tamarind” is derived from the Arabic word “Tamar-E-Hind,” meaning “Date of India”. This tree is valued not only for its fruits and timber but also for its shade, making it a popular avenue tree. It is cultivated in tropical and subtropical regions worldwide and has become naturalized in various locations. Though, a native of tropical Africa, it is now extensively grown in Southeast Asia, Australia, and America [55]. In India, tamarind is widely cultivated, particularly in rainfed areas of Karnataka, Madhya Pradesh, Bihar, Chhattisgarh, Gujarat, Andhra Pradesh, and Tamil Nadu. Tamarind production and export are relatively limited in other Asian countries compared to Thailand and India, the sour variety of tamarind dominates global production, accounting for 95% of the total output. India has a long history of exporting processed tamarind pulp to Western countries, including recent exports to the United States. Annual exports to the U.S. exceed 10,000 tonnes, generating approximately 100 million Indian rupees [9]. India remains the leading producer of tamarind with over 59,000 ha under cultivation and a production of about 200,000 metric tonnes [24].
It can tolerate a wide range of temperatures and high humidity levels but thrives best in regions where the mean annual rainfall is 500–1500 mm and temperature ranges between 25 and 45 ˚C. It can withstand remarkable hardiness in drought, nutrient deficiency, and poor soil quality conditions [53]. Tamarind trees can tolerate up to 4,000 mm of annual rainfall, as long as the soil is well-drained [11]. Tamarind trees can thrive in slightly acidic to neutral soils having an optimal pH range of 6.0 to 8.5. It can be successfully grown in sodic soils with 49% exchangeable sodium without the need for amendments such as gypsum or pyrite [12]. The United Nations Decade on Ecosystem Restoration (2021–2030) advocates for the use of native species to bolster ecosystems and advance sustainable development goals. This initiative aims to eradicate poverty, enhance food security, improve soil and water quality, and conserve biodiversity, highlighting the untapped potential in restoration and agronomy [7].
Tamarind is a large evergreen or semi-evergreen tree with a nutrient-rich composition that includes vitamins, minerals, fiber, and antioxidants, offering significant health benefits [56]. Its pulp is high in vitamin C, thiamine, iron, calcium, phosphorus, and dietary fiber, along with bioactive compounds such as polyphenols and flavonoids with antioxidant and anti-inflammatory properties [29, 57]. The fruit pulp, pericarp, seeds, and leaves of the tamarind are all natural sources of antioxidants that can be used as substitutes for manufactured ones. The soil, climate, location, and other elements all affect the chemical makeup. Bioactive substances having antibacterial, anticancer, and spasmolytic effects can be found in tamarind seeds. Antioxidants such as succinic acid, taxifolins, and catechin are found in the pulp, whereas tannins present in the pulp have antibacterial and antiulcer properties [13, 29, 57]. The pulp’s tartaric acid has laxative, antibacterial, and antioxidant properties. The tamarind’s terpenoids have antibacterial and anti-inflammatory qualities, and the leaves have antioxidants such as naringenin, isovitexin, and vitexin. Parts of the tamarind are used to cure a variety of diseases such as hemorrhoids, diarrhea, and jaundice [2, 34]. Coughs, liver problems, and other conditions are treated by consuming tamarind leaves diluted with salt and water. Tamarind is also frequently used as a flavoring ingredient in sauces, juices, pickles, preserves, and toffees. It is the most abundant natural source of tartaric acid, which is an essential acidulant in cooking [52]. To address the increasing demand for herbal medicines and associated items, commercial tamarind cultivation is necessary.
India’s Protection of Plant Varieties and Farmers’ Rights Act (PPVFRA, 2001) was passed in 2001 as a result of the enforcement of Trade-Related Aspects of Intellectual Property Rights (TRIPS), which highlighted the significance of varietal identification and documentation for granting Plant Breeders’ Rights. To obtain unique cultivars, this law mandates evaluating distinctness, uniformity, and stability (DUS) [25]. Thirty tamarind genotypes were conserved in the field gene banks as part of a project that the Protection of Plant Varieties and Farmers’ Rights Authority (PPV and FRA) started with the ICAR-CIAH-Central Horticultural Experiment Station in Gujarat to address the need for trustworthy descriptors for tamarind. A specialist task team created morphological descriptors for tamarind between 2012 and 2024, using ICAR-CHES as the primary testing facility.
The lack of research on desired morphological features, which are essential for managing germplasm and cultivars, is the primary obstacle to tamarind improvement [33]. To prevent genetic erosion and to make better use of superior germplasm in crop improvement, it is necessary to discover promising genotypes based on desirable horticultural traits and their ex-situ clonal conservation in India’s varied gene pool [36]. The study evaluated the tamarind genotypes for morphological and physico-chemical quality traits, aiming to enhance the economic potential of tamarind as a valuable cash crop and support rural economies. For effective breeding of perennial fruit trees like tamarind, a thorough characterization of germplasm resources is essential. Additionally, local collections demonstrate strong adaptability and represent a valuable genetic resource for breeding programs. The present study uses multivariate analyses to explore genetic variability in tamarind, focusing on key traits such as tree growth, pod-related physico-chemical characteristics, and yield by identifying the most informative traits, this work aims to guide future breeding strategies for improving yield and quality.
Materials and methods
Study site and experimental material
The present investigation was carried out at the experimental tamarind germplasm blocks of the Central Horticultural Experiment Station (ICAR- CHES) in Godhra, Gujarat, India, located at latitude 22˚41′38″ N, longitude 73˚33′22″ E, and at an elevation of 113 m above sea level (Fig. 1). All the tamarind genotypes were established through in-situ grafting, and planted in a square system of planting at 10 m spacing. The field view of tamarind germplasm blocks is shown in Fig. 2. The formal identification of the specimens was performed by Late Dr. Sanjay Singh. A voucher specimen of this material has been deposited in the publicly available herbarium of ICAR-Central Horticultural Experiment Station, Vejalpur with deposition number TI-1619.
Fig. 1.

Geographic location of the experimental tamarind germplasm blocks at ICAR- CHES, Godhra, Gujarat, India
Fig. 2.

The field view of the studied tamarind germplasm blocks
Four plants represented each genotype, and each plant served as a replication. The planting arrangement followed a randomized block design. The age of the trees in the orchard varied from 19 to 20 years. The tamarind germplasm used for developing minimal descriptors comprised 30 genotypes. The genotypes were collected through surveys of diversity-rich areas and from research organizations from various agroecological zones across the Nation. Each collection site was visited twice once during the flowering period and next during the ripening phase to analyze both the morphological and qualitative characteristics of the fruits. After analyzing various desired traits, scion shoots were collected during June-July, and in-situ grafting was carried out in the experimental field of the Station.
The main criteria used for selecting genotypes included traits like growth habit, leaf, inflorescence, pod, mature pod length, bearing tendency, ripening period, pulp weight, seed weight/pod, vitamin C, titratable acidity, and yield. All genotypes were assessed under the agro-climatic conditions of a rainfed hot semi-arid environment, with an average annual rainfall of about 750 mm and temperature extremes ranging from 35 to 46 °C in summer to 8–25 °C in winter. The experimental site consisted of loam to clay loam soil, containing 153.80 kg/ha available nitrogen, 8.40 kg/ha phosphorus, and 154.81 kg/ha potassium at soil depths 0–15 cm. The soil had a pH of 7.90, an EC of 1.27 dS/m, a bulk density of 1.58 g/cc, a hydraulic conductivity of 0.37 cm/h, and an organic carbon content of 0.41%. During the experimentation, each tree consistently received a uniform dose of 50 kg of farmyard manure, 1.25 kg of nitrogen, 0.75 kg of phosphorus, and 1.25 kg of potash per tree at the experimental block of the Institute. Standard cultural practices were applied uniformly to all tamarind trees. Comprehensive descriptions for 28 traits of tamarind germplasm in terms of tree stature, growth habit, tree shape, trunk bark color, tree foliage type, new flush color, leaf size, leaf shape, leaf apex, inflorescence (panicle) length, inflorescence color, matured fruit color, mature fruit pulp color, mature pod shape, mature pod length, mature pod weight, pod stalk girth, bearing tendency, mature pod breadth, seed size, seed shape, seed color, ripening period, seed weight/pod, vitamin C, titratable acidity, pulp, TSS at ripe stage and yield. While documenting the tamarind genotypes in the rainfed hot semi-arid conditions (Table 1), descriptors were selected for their consistent expression and stability across experimental sites throughout the study.
Table 1.
Frequency distribution for morphological characters of the tamarind genotypes
| Frequency (No. of genotypes) | ||||||
|---|---|---|---|---|---|---|
| Character | 1 | 2 | 3 | 5 | 7 | 9 |
| Tree stature | Tall (18) | - | - | - | - | Small (12) |
| Growth habit | Spreading (10) | Semi-spreading (12) | Upright (8) | - | - | |
| Tree shape | Round (8) | Oval (7) | Irregular (15) | - | - | |
| Trunk bark color | Grey, 197 A (12) | Whitish-grey, 199B (7) | Brownish grey, 202B (11) | - | - | - |
| Tree foliage type | Sparse (11) | - | - | - | - | Dense (19) |
| New flush color | - | - | Reddish green (13) | Reddish brown (17) | ||
| Leaf size | Small (16) | - | - | Large(14) | ||
| Leaf shape | - | - | Elliptical (8) | Oblong (10) | Oval (12) | - |
| Leaf apex | Acute (14) | Obtuse (16) | - | - | - | - |
| Inflorescence (panicle) length | - | - | Low, < 10 cm (7) | Medium, 10–12 cm (9) | High, > 12 cm (14) | - |
| Inflorescence color | - | - | Deep pink (8) | Pinkish green (10) | Pinkish yellow (12) | - |
| Matured fruit color | - | - | Brown (6) | Reddish brown (9) | Grey (15) | - |
| Mature fruit pulp color | - | - | - | Brown (12) | Reddish brown (18) | - |
| Pod shape | - | - | Curved and bulged (9) | Straight and bulged (8) | Curved and flattened (6) | Straight and flattened (7) |
| Mature pod length | - | - | Short, < 10 cm (5) | Medium, 10–15 cm (8) | Long, > 15 (17) | - |
| Mature pod weight | - | - | Low, < 15 g (7) | Medium, 15–25 g (10) | High, > 25 g (13) | - |
| Pod stalk girth | Thick, <8 mm (13) | Thin, >8 mm (17) | - | - | - | - |
| Bearing tendency | Shy bearing (14) | - | - | - | - | Heavy bearing (16) |
| Mature pod breadth | - | - | Low, < 1 cm (9) | Medium, 1–2 cm (11) | High, > 2 cm (10) | - |
| Seed length | Small, < 0.5 cm (10) | - | Medium, 0.5–1 cm (12) | Large, > 1 cm (8) | - | - |
| Seed shape | Triangular (5) | - | Round (8) | Oval round (7) | Rectangular (7) | Parallelogram (3) |
| Seed color | Light brown (12) | Dark brown (18) | - | - | - | - |
| Ripening period | - | - | Early, < 255 days (9) | Mid, 255–270 days (11) | Late, > 270 days (10) | - |
| Seed weight/pod | - | - | Low, < 4 g (8) | Medium, 4–6 g (9) | High, > 6 g (13) | - |
| Vitamin C | Low, < 10 mg/100 g (8) | - | Medium, 10–12 mg/100 g (12) | - | High, > 12 mg/100 g (10) | - |
| Titratable acidity | - | - | Low, < 8% (8) | Medium, 8–10% (10) | High, > 10% (12) | - |
| Pulp TSS at ripening stage | - | - | Low, < 60 ˚Brix (13) | Medium, 60–70 ˚Brix (15) | High, > 70 ˚Brix (4) | - |
| Yield | Low, < 50 kg/tree (8) | - | - | Medium, 50–70 kg/tree (10) | High, > 70 kg/tree (12) | - |
However, the primary focus of this study has been on using clear visual scoring methods to simplify the recording of observations. We have carefully incorporated the essential characteristics from previous descriptors required for a comprehensive characterization of the genotypes. For leaf observations, fully mature leaves from the middle portion of the current season’s growth, ensuring no signs of active growth were selected. Tree stature is classified as tall or small; growth habit is described as spreading, semi-spreading, or upright; tree shape is characterized as round, oval, or irregular; trunk bark color as shades of grey, whitish-grey and brownish-grey; tree foliage type is categorized as sparse or dense; new flush color was classified as radish green to radish brown; leaf size is classified as small or large; leaf shape as elliptical, oval, or oblong; leaf apex shape as acute or obtuse. Inflorescence was measured in centimeters using a scale; freshly opened flowers were selected to observe their color. Fruit color was categorized as brown, reddish brown, and grey, while mature pulp color was brown or reddish brown. Matured pod shape was classified as curved or straight with bulged and flattened, and pod length was measured in centimeters using a scale. The weight of mature pods, seeds/ pod, and yield were determined with an electronic balance, while pod stalk girth, seed length, and mature pod breadth were measured with a Vernier caliper. Bearing tendency was categorized as shy or heavy; seed color was classified as light brown and dark brown; the time of fruit ripening was recorded as early, mid, and late, based on changes in physico-chemical characteristics and the duration from fruit setting to ripening. Photographs of plants or plant parts were photographed with a Sony Cyber-Shot digital camera (Japan) from the field repository to document the morphological descriptors. The experiment was laid out in a randomized complete block design and observations on various quantitative and qualitative parameters were recorded from randomly sampled trees (n = 3) of each accession. The harvested samples were cleaned with a moist cloth to remove dust and control field heat. The fresh fruit samples were analyzed for TSS, titratable acidity, and vitamin C. The fruit pulp was uniformly mashed with a mortar and pestle, and the TSS was measured from the pulp using a manual refractometer [59, 61]. A measured quantity of the sample was titrated with 0.1 N NaOH solution, using phenolphthalein as the indicator. Ascorbic acid content was determined using the dinitrophenylhydrazine (DNPH) method. The fresh sample was homogenized in a mortar pestle, with 20 mL of a mixture of 6% (w/v) metaphosphoric acid in 2 mol/L acetic acid. The mixture was centrifuged at 10,000 rpm for 15 min at 4 oC. The supernatant was filtered through Whatman filter paper (No. 1). The extract was titrated against dye and the titrate value was noted when the pink color appeared. The value was expressed as mg/100 g FW [60, 61]. Standard procedure was used for the estimation of tartaric acid (%), reducing sugars (%), non-reducing sugars (%), and total sugars (%) as described in AOAC [5].
Data analysis
Genetic variability analysis
Combining Python and R programming languages performed for the data analysis to be carried out, allowing a thorough investigation of the agronomic features under evaluation. These studies sought to better understand genetic diversity, phenotypic relationships, and clustering patterns among the genotypes, thus providing data for sensible breeding techniques. Genetic parameters such as heritability (ℎ2), genotypic coefficient of variation (GCV), phenotypic coefficient of variation (PCV), genetic advance (GA), and genetic advance as a percentage of mean (GAM) were calculated as per standard procedure [35]. These calculations followed standard formulas as described by Burton and De Vane [8] for GCV and PCV, and Johnson et al. [18] for GA and heritability (h2). Using the Pandas and NumPy tools, Python constructed these measures to handle and probe the data, while R’s Agricole package [35] was used for advanced statistical computations.
Character association analysis
The correlations among these factors were assessed using correlation analysis. The genotypic and phenotypic associations computed and visualized the data using Python’s seaborn library’s heatmaps. These heatmaps clearly showed trait interdependencies, necessary to find characteristics that may be indirectly chosen in breeding programs. Then the direct and indirect impacts of many variables were separated using path analysis on the main interest feature, yield (PY kg/tree). An ordinary least squares (OLS) regression model was fitted using the Python statistics package, allowing route coefficient computation.
Principal component analysis (PCA)
The principal component analysis (PCA) conducted in this study includes both qualitative and quantitative data. The qualitative data were coded as ordinal categories to make them compatible with the PCA process [15]. This step ensures that the qualitative variables are accurately represented and contribute meaningfully to the analysis [19]. Kaiser normalization was applied during the PCA to standardize the data, ensuring comparability between variables with different scales [20]. Additionally, the Varimax rotation method was used to enhance the interpretability of the components. Varimax rotation is an orthogonal rotation technique that maximizes the variance of factor loadings, thereby clarifying the relationships between components and making the results more interpretable [17]. The analysis was conducted with eigenvalues up to 1, meaning that only components with eigenvalues greater than 1 were considered. This approach ensures that only meaningful components are selected, while those with lower explanatory power are excluded [1]. According to the Kaiser criterion, components with eigenvalues less than 1 are not considered significant as they do not contribute enough to explain the variance in the data. The combination of Kaiser normalization and Varimax rotation provides a robust and interpretable PCA model, allowing for a clearer understanding of the relationships between variables. This methodology facilitates a more in-depth analysis of the data and ensures the model is interpreted with a high degree of reliability [21]. Using the sci-kit-learn suite, PCA was used to lower dataset dimensionality and find main variance sources. Displayed PCA findings were biplots showing the accession distribution among the principal components and scree graphs. This method makes it possible to find features most likely influencing variance among the genotypes, therefore helping focused selection in breeding projects.
Cluster analysis
Accession grouping based on feature profiles was made possible via hierarchical clustering. This effort uses the SciPy library, seaborn-generated dendrograms, and heatmaps. Cluster mean analysis helps to expose the genetic diversity among the genotypes by clarifying the special characteristics of every group. Estimated inter- and intra-cluster distances calculated from the 𝐷2 statistic helped to evaluate genetic diversity among clusters. This study guides the parent selection for hybridizing projects and clarifies accession genetic interactions. Last, simulated yield and other factors were used for simple linear regression analysis to assess the relationship between individual traits and the dependent variable, and multiple regression to evaluate the combined effect of multiple traits on the dependent variable. The stats models application assisted in fitting models using OLS regression; the produced regression graphs were then used to find the most significant elements influencing yield. Knowing which features increase overall output helps breeders concentrate on the most important ones. Used Python and R wherever the study offered the freedom and depth required to thoroughly review the data. The techniques used promised strong, repeatable findings that would be invaluable for directing further breeding projects.
Results and discussion
Morpho-physico-chemical variability
The variability observed in the 28 tamarind traits was captured through the identification of distinct descriptors and states (Table 1). This variability is key for optimizing germplasm use and conservation, as understanding genetic diversity is essential for tamarind breeding programs [27, 48]. Despite its importance, the limited knowledge in this area poses challenges to effective germplasm management. Documenting morphological traits is critical for improving tamarind varieties in breeding programs [37, 54]. The study revealed significant trait variation across genotypes, underscoring the influence of genetic diversity in selecting cultivars suited to specific purposes [23, 40].
In addition to having useful breeding uses, traits like tree length, growth habit, foliage, and pod morphology are essential descriptors for genotype identification. Because they are easier to harvest, smaller trees would be better suited for commercial agriculture, as evidenced by the observed variance in tree stature, with 18 genotypes tall and 12 tiny [3, 10]. Additionally, preferences for commercial cultivation are reflected in changes in growth habits, such as upright, semi-spreading, and spreading kinds; semi-spreading forms make harvesting easier [51]. Similar to this, differences in the color of the trunk bark and characteristics of the foliage, like the size, shape, and apex of the leaves, offer important information for choosing cultivars, with some attributes showing climatic tolerance [23, 25, 54].
The study further identified diversity in inflorescence characteristics, with varying lengths and colors, which is important as these factors influence fruit yield and quality [31, 50]. Similarly, fruit and pulp characteristics, including color, shape, and weight, demonstrated clear genetic variability, although environmental factors may also contribute. Notably, the variation in fruit color and pulp content can serve as quality indicators, important for both consumer preference and marketability [47, 53].
Additionally, the study divided ripening periods into three groups: early, medium, and late. For market readiness, early ripening cultivars were favored [26]. Significant differences in titratable acidity and vitamin C levels were noted in terms of nutritional content, which may influence product quality and consumer approval [17, 41]. The genetic variability seen in these variables can improve tamarind breeding efforts aimed at flavor and processing features, as the variance in TSS content is essential for determining fruit sweetness [23, 50].
The genotypes Thar Rashmi, Goma Prateek, and Pratishthan are particularly promising for both fresh fruit and industrial applications due to their higher yield potential, according to the classification of yield potential into high, medium, and low categories [47, 55]. Breeders can use this variability to choose tamarind genotypes that meet a variety of commercial and agricultural requirements.
Variations in the traits related to tree (Fig. 3), leaf (Fig. 4), inflorescence (Fig. 4), pod (Fig. 5), and seed (Fig. 6) of the studied tamarind genotypes are highly variable. The observed genetic variation across a wide range of morphological and yield-related traits in tamarind demonstrates the rich potential for further exploitation and improvement in breeding programs. Understanding these traits can lead to the development of better-adapted, higher-yielding, and more marketable tamarind varieties.
Fig. 3.

Variation in growth behavior of the tamarind genotypes: tree stature (a. tall and b. dwarf), growth habit (c. upright, d. semi-spreading, and e. spreading), tree shape (f. irregular, g. oval, and h. round), and trunk bark color (i. brownish grey, j. whitish-grey, and k. grey)
Fig. 4.

Variability of tree foliage type (a. dense and b. sparse), leaf size (c. small and d. large), leaf apex (e. obtuse and f. acute), leaf shape (g. elliptical, h. oval, and i. oblong), inflorescence color (j. deep pink, k. pinkish green, and l. pinkish yellow), and new flush color (m. reddish green and n. reddish brown) in the tamarind genotypes
Fig. 5.

Variability in pod color (a. brown, b. grey, and c. reddish brown), pulp color (d. reddish brown and e. brown), bearing habit (f. heavy and g. shy), and pod shape (h. straight bulged, i. straight flattened, j. curved flattened, and k. curved and bulged) in the tamarind genotypes
Fig. 6.

Variability in seed shape (a. parallelogram, b. triangular, c. oval round, d. round, and e. rectangular), and seed color (f. dark brown and g. light brown) in the tamarind genotypes
Genetic variability studies for growth, yield, and quality traits
Genetic variability, heritability, genetic advances, and genetic advances as a percentage of the mean were evaluated for growth, yield, and quality traits across 30 tamarind genotypes. The phenotypic coefficient of variation values slightly surpassed the genotypic coefficient of variation values, indicating minimal environmental impact on these traits. Consequently, direct selection could significantly enhance trait improvement.
Genetic parameter estimates for various yield characteristics in tamarind have been given in Table 2. High phenotypic coefficient of variation (PCV) and genotypic coefficient of variation (GCV) were observed for tree height (24.34 and 21.26), stem girth (26.63 and 23.72), tree spread E-W (23.50 and 21.68), tree spread N-S (27.46 and 24.38), pod yield kg per tree (29.98 and 27.56), pod length (25.29 and 24.51), pod breadth (22.08 and 21.92), pulp weight (30.49 and 28.58) and pod weight 31.03 and 29.74). These traits display high variation, suggesting significant potential for selection. Moderate PCV and GCV were found for the number of primary branches per tree (14.13 and 11.31), number of flowers per inflorescence (16.45 and 11.06), seed weight (14.38 and 10.14), number of seeds per pod (13.48 and 10.01), shell weight (13.68 and 10.42), fiber weight (19.59 and 13.99), pulp seed ratio, pulp percentage, seed percentage, shell percentage, fiber percentage (19.67 and 12.64) and non-reducing sugar (12.69 and 8.32) least variation present between traits, but traits like tartaric acid (4.80 and 3.53), total sugar (5.05 and 3.63), reducing sugar (6.07 and 4.27), and vitamin C (5.09 and 3.34) exhibited low variability, indicating minimal genetic diversity for these traits.
Table 2.
Estimates of genetic parameters for various characters in the tamarind genotypes
| Character | Abbreviation | Unit | PCV | GCV | h2 | GA | GAM |
|---|---|---|---|---|---|---|---|
| Tree height | TH | m | 24.34 | 21.26 | 87.35 | 1.32 | 17.05 |
| Stem girth | SG | cm | 26.63 | 23.72 | 89.07 | 3.71 | 21.70 |
| Tree spread E-W | TSE-W | m | 23.50 | 21.68 | 92.26 | 0.38 | 16.37 |
| Tree spread N-S | TSN-S | m | 27.46 | 24.38 | 88.78 | 0.34 | 19.64 |
| Pod yield | PY | kg/tree | 29.98 | 27.56 | 91.93 | 2.33 | 26.73 |
| Pod yield per tree | PYT | t/ha | 29.98 | 27.56 | 91.93 | 2.33 | 26.73 |
| Number of primary branches /tree | NPB | Number | 14.13 | 11.31 | 80.04 | 1.02 | 15.82 |
| Number of flowers/inflorescence | NoF | Number | 16.45 | 11.06 | 67.23 | 1.91 | 12.20 |
| Pod length | PL | cm | 25.29 | 24.51 | 96.92 | 3.82 | 20.82 |
| Pod breadth | PB | cm | 22.08 | 21.92 | 99.28 | 3.23 | 18.42 |
| Seed weight | SW | g | 14.38 | 10.14 | 70.51 | 0.67 | 16.28 |
| Number of seed/pod | NoS | Number | 13.48 | 10.01 | 74.26 | 0.93 | 12.84 |
| Shell weight | SHW | g | 13.68 | 10.42 | 76.17 | 0.65 | 18.34 |
| Fiber weight | FW | g | 19.59 | 13.99 | 71.41 | 0.13 | 22.56 |
| Pulp weight | PW | g | 30.49 | 28.58 | 93.74 | 2.93 | 28.97 |
| Pulp: Seed | P: S | Number | 19.92 | 15.91 | 79.87 | 0.35 | 14.35 |
| Pulp percentage | P | % | 12.84 | 7.99 | 62.23 | 4.36 | 22.80 |
| Seed percentage | S | % | 12.17 | 7.88 | 64.75 | 2.99 | 12.70 |
| Shell percentage | SH | % | 11.97 | 8.09 | 67.59 | 2.81 | 9.60 |
| Fiber percentage | F | % | 19.67 | 12.64 | 64.26 | 0.67 | 17.95 |
| Pod weight | PWT | g | 31.03 | 29.74 | 95.84 | 1.51 | 33.64 |
| Tartaric acid | TA | % | 14.80 | 13.53 | 91.42 | 2.57 | 11.62 |
| Total sugar | TS | % | 5.05 | 3.63 | 71.88 | 2.24 | 9.70 |
| Reducing sugar | RS | % | 6.07 | 4.27 | 70.35 | 1.91 | 6.80 |
| Non-reducing sugar | NRS | % | 12.69 | 8.32 | 65.56 | 1.15 | 10.06 |
| Vitamin C | VIC | mg/100 g | 15.09 | 13.34 | 88.40 | 0.51 | 10.84 |
GCV Genotypic co-efficient of variation, PCV Phenotypic co-efficient of variation, h2 Heritability (broad sense), GA Genetic advance, GAM Genetic advance as % mean
High broad-sense heritability aids in identifying desirable traits for selection, enabling breeders to concentrate on superior genotypes based on their phenotypic characteristics. Across all yield characteristics, broad-sense heritability varied from 62.23% (pulp percentage) to 99.28% (pod breadth), demonstrating strong heritability least influenced by environmental factors. Genetic advances as a percentage of the mean ranged from 6.80 (reducing sugar) to 33.64 (pod weight). Notably, high genetic advances were observed for pod weight (33.64), stem girth (21.70), pod yield per kg (26.73), pod length (20.82), fiber weight (22.56), pulp percentage (22.80), pulp weight (28.97). Moderate genetic progress was noted for traits like tree height (17.05), tree spread E-W (16.37), tree spread N-S (19.64), number of primary branches per tree (15.82), number of flowers per inflorescence (12.20), pod breadth (18.42), seed weight (16.28), number of seeds per pod (12.84), shell weight (18.34), pulp seed ratio (14.35), seed percentage (12.70), fiber percentage (17.95), tartaric acid (11.62), non-reducing sugar (10.06), vitamin C (10.84). Low genetic progress was noted for shell percentage (9.60), total sugar (9.70), and reducing sugar (6.80) [31, 47, 49]. Traits such as pod weight, stem girth, pod yield per kg, pod length, fiber weight, pulp percentage, and pulp weight demonstrated high heritability along with significant genetic advances, suggesting these traits are influenced by additive or fixable genetic variation and are suitable for effective selection. High heritability in the present study suggests that genetic factors predominantly influence the trait, with minimal environmental variation. This is often observed in controlled breeding programs or uniform environmental conditions [14, 38]. The probability of genetic improvement depends on an evaluation of variability; greater values of heritability and GAM indicate features that are fit for selection. In contrast, traits like shell percentage, total sugar, and reducing sugar showed high heritability but low genetic advance, indicating non-additive gene action and limited response to selection [10, 16, 31]. Therefore, hybridization may be a more effective strategy for improving these traits [23].
Character association studies for growth, yield, and quality traits
The genotypic and phenotypic correlation coefficients for various traits in tamarind genotypes are summarized in Figs. 7 and 8, respectively. This investigation underlined important characteristics that greatly influence yield, either directly or by their impact on other features. Positive correlations were observed between pod yield per tree and several traits, including the number of flowers per inflorescence (rg = 0.25, rp = 0.11), pod length (rg = 0.24, rp = 0.33), seed weight (rg = 0.48, rp = 0.44), number of seeds per pod (rg = 0.30, rp = 0.24), and various quality parameters like seed percentage (rg = 0.36, rp = 0.28), total sugar (rg = 0.37, rp = 0.48), and vitamin C (rg = 0.21, rp = 0.09). These results emphasize the importance of traits such as flower count, pod length, seed weight, and sugar content in improving pod yield [49]. Conversely, negative correlations were found with the number of primary branches per tree (rg = -0.17, rp = -0.21), pulp weight (rg = -0.07, rp = -0.05), and pulp percentage (rg = -0.25, rp = -0.28), highlighting the potential trade-offs between yield and certain quality traits.
Fig. 7.

Genotypic correlation coefficient heatmap between 26 traits in the tamarind genotypes. For abbreviations, please see Table 2
Fig. 8.

Phenotypic correlation coefficient heatmap between 26 traits in the tamarind genotypes. For abbreviations, please see Table 2
The results indicated that taller trees with larger girth and wider spread lead to better pod yield. Tree height also exhibited substantial positive associations with stem girth (rg = 0.97, rp = 0.97), tree spread (E-W: rg = 0.84, rp = 0.86; N-S: rg = 0.82, rp = 0.88), and pod yield per tree (rg = 0.65, rp = 0.66). However, pulp-related qualities and primary branches per tree (rg = -0.25, rp = -0.30) also showed negative associations, suggesting that increasing quality attributes may not always be in line with optimizing tree size [49].
Stem girth was positively correlated with tree spread (E-W: rg = 0.75, rp = 0.83; N-S: rg = 0.74, rp = 0.84) and pod yield per tree (rg = 0.57, rp = 0.56), emphasizing its role in structural development and potential yield. Similarly, tree spread in both directions (E-W and N-S) correlated positively with pod yield (kg/tree) and several quality parameters such as total sugar and fiber weight. This further supports the importance of tree architecture in optimizing yield and quality traits [32, 43].
Pod-related traits such as pod length and pod breadth showed positive correlations with seed weight, number of seeds per pod, shell weight, and sugar content, reinforcing their significance as yield contributors. Seed weight itself demonstrated strong associations with multiple quality traits, including the number of seeds per pod (rg = 0.44, rp = 0.50), shell weight (rg = 0.53, rp = 0.53), and total sugar content, indicating that larger seeds could enhance both yield and quality [54].
Subsequent investigation showed that there were intricate correlations between quality attributes such as sugar concentration, pulp weight, and fiber weight. While pulp weight showed negative connections with several quality indicators, such as seed percentage and shell percentage, fiber weight showed favorable associations with fiber percentage, total sugars, and reducing sugars. According to these results, increasing yield through fiber and seed parameters might have impacted pod pulp quality characteristics [32, 54].
Additionally, correlations involving secondary metabolites such as tartaric acid, total sugar, and reducing sugar showed positive relationships with several traits, including pod weight and seed weight, highlighting their potential as markers for quality selection in tamarind breeding. This trade-off must be carefully managed in breeding programs to ensure that increased yields do not compromise the overall quality of the fruit. Character association studies in tamarind genotypes were also earlier reported [32, 54].
In conclusion, the study underscores the importance of focusing on key traits like pod yield, seed weight, sugar content, and fiber percentage for tamarind breeding programs. The genotypic correlations were generally stronger than the phenotypic ones, suggesting a robust genetic basis for the observed relationships. Prioritizing traits such as pod length, seed weight, and fiber content could significantly enhance both yield and quality in tamarind cultivation. These results align with previous studies by Singh and Nandini [49], Rajamanickam [43], and Mayavel et al. [32].
Path coefficient analysis
Path coefficient analysis is a statistical method used to partition the direct and indirect effects of factors influencing a dependent variable [58]. Pod yield is a complex trait influenced by multiple factors. Correlation alone does not adequately reveal which traits have the most substantial impact on pod yield in tamarind. These variables affect pod yield both directly and indirectly and are intricately interconnected. Path coefficient analysis in tamarind assesses both the direct and indirect effects of various traits on a target trait, such as pod yield. This approach is essential for identifying the key traits that significantly impact the target trait and for understanding the complex relationships among traits in a tamarind improvement program. Observations showed a positive direct effect on pod yield per tree from traits such as stem girth, tree spread E-W, pod yield per tree (t/ha), number of primary branches per tree, number of flowers per inflorescence, seed weight, number of seeds per pod, pulp weight, pulp seed ratio, pulp percentage, shell percentage, and fiber percentage. The analysis revealed positive indirect effects on pod yield per tree through various traits (Table 3). Specifically, tree height (6.5), stem girth (5.7), tree spread E-W (6.9), tree spread N-S (6.6), pod yield (kg/tree) (6.5), pod yield per tree (t/ha) (6.5), number of flowers per inflorescence (2.5), pod length (2.4), pod breadth (0.3), seed weight (4.8), number of seeds per pod (3.0), shell weight (2.6), fiber weight (1.3), seed percentage (3.6), shell percentage (0.7), fiber percentage (0.4), pod weight (1.5), all demonstrated significant positive indirect effects on pod yield per tree in tamarind genotypes. Considering these direct and indirect effects on pod yield, characters exhibiting the highest direct effect, contributing indirectly could be selected for higher pod yield in tamarind [23, 32, 51].
Table 3.
Path coefficient analysis of growth, yield, and quality in the tamarind genotypes
| Character | Direct effect | Indirect effect |
|---|---|---|
| Tree height | -2.84-14 | 6.5 |
| Stem girth | 4.44-15 | 5.7 |
| Tree spread E-W | 1.42-14 | 6.9 |
| Tree spread N-S | -5.68-14 | 6.6 |
| Pod yield per tree | 10 | -7.32-14 |
| Number of primary branches /tree | 2.66-15 | -1.7 |
| Number of flowers/inflorescence | 3.33-16 | 2.5 |
| Pod length | -7.11-15 | 2.4 |
| Pod breadth | -1.60-14 | 0.3 |
| Seed weight | 2.84-14 | 4.8 |
| Number of seed/pod | 1.42-14 | 3.0 |
| Shell weight | -1.42-14 | 2.6 |
| Fiber weight | -1.42-13 | 1.3 |
| Pulp weight | 2.13-14 | -0.7 |
| Pulp: Seed | 4.26-14 | -2.9 |
| Pulp percentage | 1.33-15 | -2.5 |
| Seed percentage | -1.42-14 | 3.6 |
| Shell percentage | 1.78-15 | 0.7 |
| Fiber percentage | 2.49-14 | 0.4 |
| Pod weight | -2.84-14 | 1.5 |
| Tartaric acid | -2.66-15 | 3.7 |
| Total sugar | 1.42-14 | 3.7 |
| Reducing sugar | -6.22-15 | 1.7 |
| Non-reducing sugar | -6.44-15 | 4.4 |
| Vitamin C | -8.88-16 | 2.1 |
Principal component analysis (PCA)
The eigenvalues and their percentage of variation are illustrated in Table 4. As the number of principal components (PCs) increased, the eigenvalues and associated variance for each PC decreased, while a rise in cumulative variability was noted. Analysis of the variation explained by each PC indicated that PC-1 accounted for approximately 27.648% of the total variance, followed by PC-2 (18.250%) and PC-3 (15.835%). Together, these components showed eigenvalues of more than 1.00 and explained 61.733% of the total variation across 28 traits [6, 22, 28, 45]. The contribution of individual characters to genetic divergence is shown in the Supplementary 1. Pod breadth (6.752%) significantly influences genetic diversity, followed by pod length (5.810%), number of seeds per pod (5.174%), number of primary branches/ tree (5.032%), and several other traits. These characteristics greatly affect genetic divergence and could be utilized in future breeding programs to create new hybrid combinations and select from segregating populations.
Table 4.
Eigenvalues, variability percentage, and cumulative percentage variability for various principal components in the tamarind genotypes
| Principal component | Eigenvalue | Percentage of variance (%) | Cumulative percentage of variance (%) |
|---|---|---|---|
| PC1 | 7.189 | 27.648 | 27.648 |
| PC2 | 4.745 | 18.250 | 45.899 |
| PC3 | 4.117 | 15.835 | 61.734 |
The biplot illustrates the distribution of genotypes in the space defined by the first two principal components (PC1 and PC2), which together capture the majority of the variance in the data (Fig. 9). Genotypes grouped closely within the 95% confidence ellipse represent those with minimal variability and similar quantitative traits. Outliers such as Pratisthan, Ajanta, and CHEST-3 lie outside the ellipse, indicating distinct trait profiles that could be of interest to use in breeding programs. Furthermore, the spatial proximity of genotypes, such as CHEST-6, CHEST-7, and CHEST-4, suggests a strong similarity in their quantitative attributes, which may align them within the same natural cluster. These insights provide valuable information on genetic diversity, aiding targeted breeding strategies to exploit both similarities and variabilities. This implies that future breeding initiatives can gain from giving priority to these characteristics, particularly concerning fruit yield and quality. Breeders can make more informed decisions on trait prioritization and parent selection by visualizing the relationships between traits and genotypes. This approach facilitates the identification of superior cultivars that combine high yield with desirable fruit quality attributes, aiding in the selection of the most promising candidates for breeding programs [23, 61].
Fig. 9.

Biplot for the studied tamarind genotypes based on PC1/PC2
Hierarchical clustering analysis
Hierarchical cluster analysis (HCA) identified three distinct clusters among the tamarind genotypes (Supplementary 2 and Fig. 10). Cluster I, the largest, included 14 genotypes such as CHEST-2 and CHEST-3. Cluster III comprised 11 genotypes including DTS-1 and Thar Rashmi. Cluster II contained five genotypes, including Pratisthan and Goma Prateek. This clustering highlights genetic diversity and provides valuable insights for breeding and selection strategies. The dendrogram shows that genotypes clustered closely are more similar, while those farther apart have greater genetic differences [6, 22, 28, 39, 54].
Fig. 10.

Dendrogram showing the relationship among the tamarind genotypes
The Hierarchical Clustering Heatmap (HCH) illustrates 28 yield and quality traits across 30 tamarind genotypes (Fig. 11). Based on the heatmap, the genotypes were organized into four groups: Group IV consisted of genotypes (11), followed by Group II (8), Group I (6), and Group III with the least genotypes (5). The heat map visualizes the linkages and trends among various dataset attributes and samples using color gradients, where darker colors represent lower values and brighter colors indicate higher values. By analyzing these clusters and color patterns, researchers can discern relationships between traits and identify key characteristics that differentiate samples. Notably, traits such as pod length and number of seeds per pod in CHEST-7 emerge as critical factors in distinguishing high-performing germplasm, suggesting their potential for future breeding and genetic studies. Yield-related traits, including pod weight, pulp weight, and pod breadth, are essential for determining overall yield per plant. Quality traits such as pulp percentage, total sugar, non-reducing sugar, vitamin C, and tartaric acid significantly affect tamarind quality, providing insights into fruit quality and marketability. Cluster analysis facilitates the study of genetic relationships between germplasm by grouping those with similar genetic profiles. Additionally, Saran et al. [46] noted that the two-dimensional PCA plot revealed three groups like the clustering pattern observed in the UPGMA dendrogram.
Fig. 11.

Hierarchical clustering heatmap (HCH) represents 26 traits of the tamarind genotype. For abbreviations, please see Table 2
Cluster mean analysis
Cluster mean analysis is a commonly used technique for calculating the mean values of each group in clustered data. This analysis typically follows clustering algorithms and involves calculating the mean for each cluster. This allows for a better understanding of the general characteristics of the observations within each cluster and facilitates the comparison of differences between groups. This method is often used to analyze the structure of clustered data and compare the characteristic features of different groups [4]. Cluster mean analysis revealed significant variation across all growth and yield-related traits (Supplementary 3). Cluster III consistently showed the highest means for most growth traits, including tree height (6.52), stem girth (66.47), and tree spread (E-W: 6.80, N-S: 6.84), outperforming Clusters I and II [22]. In contrast, Cluster II had the highest values for pod yield per tree (49.91) and per hectare (4.99), as well as for key pod characteristics such as pod length (12.41) and breadth (2.28). It also exhibited superior seed and shell traits, with higher seed weight (5.72), seed count (7.50), and shell weight (4.59). Notably, Cluster II also excelled in pulp weight (8.71) and biochemical traits, such as total sugar (46.35) and tartaric acid levels (12.34), highlighting its potential for nutritional quality and yield.
Cluster I, while lagging in many growth and yield traits, showed higher values for the number of primary branches (5.65), pulp percentage (45.99), and pulp-seed ratio (1.89), making it favorable for certain specific breeding objectives. Cluster III, though lower in yield and nutritional traits, had the highest seed percentage (31.53), shell percentage (25.44), and fiber content (4.90), which could be beneficial for fiber-focused breeding.
Cluster II is suggested for selection in breeding programs aiming for high yield and nutritional quality because of its improved performance across several important parameters. With its robust growth characteristics, Cluster III is very useful for increasing the size and resilience of trees. These results are consistent with earlier research that highlights the value of selection and genetic diversity in breeding for desirable traits [6, 39, 45].
Intra- and inter-cluster D2 values
Intra- and inter-cluster D² values are used to evaluate the effectiveness of cluster separation in cluster analysis. Intra-cluster D² values represent the squared Euclidean distance between each data point and the centroid of its cluster, reflecting the compactness of the cluster. Lower values indicate that the points are tightly grouped around the centroid, while higher values suggest greater variability within the cluster. Inter-cluster D² values, on the other hand, represent the squared Euclidean distance between the centroids of different clusters. Higher inter-cluster D² values indicate greater dissimilarity between clusters, while lower values suggest that the clusters are more similar to each other. These values are crucial for assessing both the homogeneity within clusters and the separation between them [30, 44, 62]. The intra- and inter-cluster distances (D²) were calculated and presented in Table 5; Fig. 12. Inter-cluster distances ranged from 7.33 to 8.12, with Cluster II showing the greatest distance of 8.12 from Cluster I, indicating significant genetic differentiation. While Clusters III and I had the least distance (7.33), showing closer genetic relatedness, Cluster III had a substantial gap of 7.56 from Cluster II, suggesting unique genetic features. Cluster II had the largest intra-cluster distance (6.44), indicating significant genetic variation within this cluster, with values ranging from 5.78 to 6.44. Greater genetic uniformity was indicated by Cluster I’s lowest distance (5.78), whereas Cluster III’s was intermediate (6.12). With the greatest intra- and inter-cluster distances, Cluster II was the most diverse, suggesting distinct genetic features. When designing breeding programs to improve desired traits and genotype interactions, these findings provide valuable insights into genetic variety [22, 28].
Table 5.
Average intra- and inter-cluster distance (D2) values clusters of the tamarind genotypes
| Cluster | Cluster I | Cluster II | Cluster III |
|---|---|---|---|
| Cluster I | 5.78 | 8.12 | 7.33 |
| Cluster II | 6.44 | 7.56 | |
| Cluster III | 6.12 |
Fig. 12.
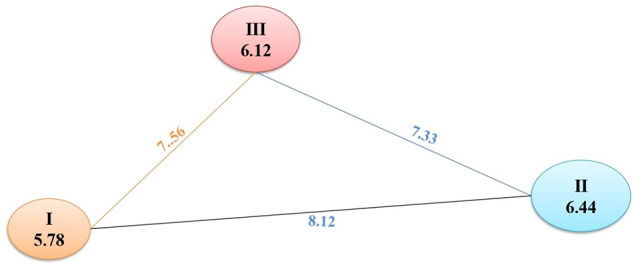
Intra- and inter-cluster distance among three clusters in the tamarind genotypes
Regression analysis (RA)
The OLS regression results reveal a model that accounts for a substantial portion of the variance in pod yield per plant (Table 6). Nonetheless, many individual predictors do not exhibit statistically significant impacts on pod yield, possibly due to multicollinearity issues that might compromise the reliability of coefficient estimates. While the model demonstrates overall robustness, it could benefit from a deeper examination of multicollinearity and potential refinement of the predictor variables. The summary of the relationships between various predictor variables and the dependent variable, pod yield per plant (kg) explains a significant amount of variance [32].
Table 6.
Values of partial regression coefficient for growth and quality traits in the tamarind genotypes
| Character | Coefficient | p-value |
|---|---|---|
| Tree height | 3.89-16 | 0.984397 |
| Stem girth | -2.84-14 | 0.993614 |
| Tree spread E-W | 4.44-15 | 0.988937 |
| Tree spread N-S | 1.42-14 | 0.996156 |
| Pod yield | -5.68-14 | 0.982395 |
| Pod yield per tree | 10 | 1.11-77 |
| Number of primary branches/tree | 2.66-15 | 0.993504 |
| Number of flowers/inflorescence | 3.33-16 | 0.999049 |
| Pod length | -7.11-15 | 0.99604 |
| Pod breadth | -1.60-14 | 0.990848 |
| Seed weight | 2.84-14 | 0.997943 |
| Number of seed/pod | 1.42-14 | 0.992922 |
| Shell weight | -1.42-14 | 0.997194 |
| Fiber weight | -1.42-13 | 0.992062 |
| Pulp weight | 2.13-14 | 0.990445 |
| Pulp: Seed | 4.26-14 | 0.99323 |
| Pulp percentage | 1.33-15 | 0.994338 |
| Seed percentage | -1.42-14 | 0.989945 |
| Shell percentage | 1.78-15 | 0.997832 |
| Fiber percentage | 2.49-14 | 0.991768 |
| Pod weight | -2.84-14 | 0.991974 |
| Tartaric acid | -2.66-15 | 0.987726 |
| Total sugar | 1.42-14 | 0.987826 |
| Reducing sugar | -6.22-15 | 0.99478 |
| Non-reducing sugar | -6.44-15 | 0.99537 |
| Vitamin C | -8.88-16 | 0.997468 |
The low p-value signifies the overall statistical significance of the model. Positive coefficients (tree height, tree spread E-W, tree spread N-S, pod yield per tree, number of primary branches per tree, number of flowers per inflorescence, seed weight, number of seeds per pod, pulp seed ratio, pulp percentage, shell percentage, fiber percentage, and total sugar) suggest a positive relationship with the dependent variable, while negative coefficients indicated a negative relationship. Overall, the model indicates that while explaining some variance in yield, many traits may not significantly impact pod yield [32]. The strong relationship between pod yield per tree (t/ha) and pod yield (kg/tree) as per the OLS regression model is illustrated in Fig. 13. The red line represents the regression line, while the blue crosses denote the simulated data points, exhibiting a correlation between pod yield per tree and pod yield, based on the regression coefficients [32].
Fig. 13.

The association between pod yield per tree (t/ha) and pod yield (kg/tree) based on the OLS regression model in the tamarind genotypes
Conclusions
The study revealed significant morphological and genetic variability among 30 tamarind germplasm, which holds promise for both agricultural and commercial applications. Tree height, stem girth, tree spread, pod yield, pod dimensions, pulp weight, and pod weight were among the variables with high PCV and GCV, suggesting considerable variability and selection potential. High heritability and genetic advance were shown by traits such as stem girth, pod yield, pod length, fiber weight, pulp percentage, and pulp weight, indicating that they are impacted by additive genetic variation and are appropriate for efficient selection. Correlation and PCA analyses identified strong relationships between growth, yield, and quality traits, highlighting the importance of these traits in breeding programs. Furthermore, the cluster and hierarchical analysis grouped genotypes based on their morphological features, providing insights into the genetic diversity within the species. For breeding programs looking to capitalize on distinctive features across clusters, such divergence is essential. Additionally, regression analysis showed correlations between predictor factors and pod yield. These findings are not only valuable for scientific understanding but also serve as a foundation for selecting invaluable germplasm that can be channeled into future breeding endeavors. This study underscores the significance of these variations in improving tamarind cultivation, offering directions for future breeding efforts aimed at optimizing yield, quality, and overall adaptability.
Electronic supplementary material
Below is the link to the electronic supplementary material.
Acknowledgements
Authors are thankful to (Late) Dr. Sanjay Singh, PS, and Head, CHES, Godhra for the collection and establishment of germplasm at the Station and the Director, ICAR-CIAH for administrative support and timely allocation of funds for conducting the present study.
Author contributions
AKS, DSM, and VY: Conceptualization, methodology, and investigation. AKS, DSM, and LPY: Writing original draft preparation. LPY, VY, GK, DSM, AS, PR, and JP: Writing-review and editing. AKS and JR: Project administration. LPY, VVP, PK, AK, and YT: Data analysis. All authors have read and agreed to the published version of the manuscript. All authors approved the final manuscript.
Funding
The authors are thankful to the Protection of Plant Varieties and Farmers’ Rights Authority (PPV and FRA), New Delhi for their financial support in conducting the present study.
Data availability
The data that support the findings of this study are available from the co-corresponding authors upon reasonable request.
Declarations
Ethics approval and consent to participate
Not applicable.
Consent for publication
Not applicable.
Research involving human participants and, or animals
Not applicable.
Informed consent
Not applicable.
Statement specifying permissions
For this study, we acquired permission to study tamarind issued by the Agricultural and Forestry Ministry of India.
Statement on experimental research and field studies on plants
The either cultivated or wild-growing plants sampled comply with relevant institutional, national, and international guidelines and domestic legislation of India.
Competing interests
The authors declare no competing interests.
Footnotes
Publisher’s note
Springer Nature remains neutral with regard to jurisdictional claims in published maps and institutional affiliations.
Contributor Information
Daya Shankar Mishra, Email: dsmhort@gmail.com.
Ali Khadivi, Email: a-khaauthori@araku.ac.ir.
References
- 1.Abdi H, Williams LJ. Principal component analysis. Wiley Interdisciplinary Reviews: Comput Stat. 2010;2(4):433–59. 10.1002/wics.101. [Google Scholar]
- 2.Adeniyi OV, Olaifa FE, Emikpe BO, Ogunbanwo ST. Phytochemical components and antibacterial activity of Tamarindus indica Linn. Extracts against some pathogens. Int J Environ. 2017;17(2):1–9. [Google Scholar]
- 3.Ajiboye AA, Ajiboye MD, Agboola DA, Iwuala EN. Effect of Ecto and endomycorrhizae on seedling growth of four savanna tree seeds in Nigeria (Tamarindus indica (L), Albezia Lebbeck (benth), Prosopis Africana (L) and Parkia biglobossa (Jacq. B). Int J Plant Res. 2016;6:25–33. 10.5923/j.plant.20160602.02. [Google Scholar]
- 4.Anderberg MR. Cluster analysis for applications. New York: Academic; 1973. [Google Scholar]
- 5.AOAC 2005. Official method of analysis, 18th edn. Association of Officiating Analytical Chemists, Washington D.C. 2005.
- 6.Ayala-Silva T, Gubbuk H, Winterstein M, Mustiga G. Pomological and physicochemical characterization of Tamarindus indica (tamarind) grown in Florida. J Agric Univ P. 2016;100(2):141–54. [Google Scholar]
- 7.Bandyopadhyay S, Maiti SK. Steering restoration of coal mining degraded ecosystem to achieve sustainable development goal-13 (climate action): united nations decade of ecosystem restoration (2021–2030). Environ Sci Pollut Res Int. 2022;59(29):88383–409. [DOI] [PMC free article] [PubMed] [Google Scholar]
- 8.Burton GW, De Vane EH. Estimating heritability in tall fescue (Festuca arundinacea) from replicated clonal material. Agron J. 1953;45(10):478–81. [Google Scholar]
- 9.Deokar VT, Walunj AA, Deokar V, Shinde PD, Dighe PK. Evaluation of chemical parameters of tamarind (Tamarindus indica Linn). Int J Food Sci Nutr. 2019;4(6):117–9. [Google Scholar]
- 10.Divakara BN, Krishnan PR, Reddy SR. Clonal variability and divergence studies in Tamarindus indica L. Indian J Agro for. 2012;14(2):53–9. [Google Scholar]
- 11.Duke JA, Terrell EE. Crop diversification matrix: introduction. Taxon. 1974;23(5–6):759–99. [Google Scholar]
- 12.Dwivedi SK, Wahid, Ali WA, Pathak RK. Effect of sodicity on growth and mineral composition of tamarind (Tamarindus indica L). Ann Agril Res. 1996;17(4):447–9. [Google Scholar]
- 13.Escalona-Arranz JC, Perez-Roses R, Jimenez IL, Rodriguez-Amado J, Argota-Coello H, Cañizares-Lay J, Sierra-González G. Chemical constituents of Tamarindus indica L. leaves. Rev Cuba Quím. 2010;22(3):65–71. [Google Scholar]
- 14.Falconer DS, Mackay TFC. 1996. Introduction to Quantitative Genetics. 4th Edition, Addison Wesley Longman, Harlow.
- 15.Hastie T, Tibshirani R, Friedman J. 2009. The elements of statistical learning: data mining, inference, and prediction. 10.1007/978-0-387-21606-5
- 16.Hazarika TK. Studies on genetic diversity and selection of elite germplasm of local tamarind from Mizoram, north-east India. Indian J Hortic. 2020;77(02):246–53. 10.5958/0974-0112.2020.00033.X. [Google Scholar]
- 17.Jackson JE. A user’s guide to principal components. Wiley; 2005.
- 18.Johnson HW, Robinson HF, Comstock RE. Estimates of genetic and environmental variability in soybeans. Agron J. 1955;47(7):314–8. [Google Scholar]
- 19.Jolliffe IT. 2002. Principal component analysis for special types of data (pp. 338–372). Springer New York. 10.1007/0-387-22440-8_13
- 20.Kaiser HF. The varimax criterion for analytic rotation in factor analysis. Psychometrika. 1958;23(3):187–200. 10.1007/BF02289233. [Google Scholar]
- 21.Kaiser HF. The application of electronic computers to factor analysis. Educ Psychol Meas. 1960;20(1):141–51. 10.1177/001316446002000116. [Google Scholar]
- 22.Kanupriya C, Karunakaran G, Singh P, Venugopalan R, Samant D, Prakash K. Phenotypic diversity in Tamarindus indica L. sourced from different provenances in India. Agro Syst. 2024;98(2):477–90. [Google Scholar]
- 23.Khadivi A, Mirheidari F, Saeidifar A, Moradi Y, Tunç Y. Multivariate analysis of morphological variables in tamarind (Tamarindus indica L). BMC Plant Biol. 2024;24:1154. 10.1186/s12870-024-05872-1. [DOI] [PMC free article] [PubMed] [Google Scholar]
- 24.Kishore K, Kanupriya C, Samant D, Acharya GC, Singh HS, Sahu A. Phenological description and thermal time requirement of tamarind (Tamarindus indica) in tropical conditions. Ann Appl Biol. 2022;181(3):309–20. 10.1111/aab.12777. [Google Scholar]
- 25.Krishna H, Bhargava R, Chauhan N, Sharma SK. Morphological descriptor for DUS testing of Indian jujube (Ziziphus mauritiana). Indian J Agric Sci. 2016;86(6):809–14. [Google Scholar]
- 26.Krishna H, Singh D, Singh RS, Meena RK, Kumar L. Phyllotaxic diversity as a means of assessing variations in mulberry ([if gte mso 9]> 16.00 [endif][if gte mso 9] Normal 0 false false false EN-US X-NONE HI [endif][if gte mso 9][endif][if gte mso 10][endif]Morus spp). Int J Minor Fruits Med Aro Mat Plants. 2019;5:38–43. [Google Scholar]
- 27.Krishna H, Sarolia D, Parashar A, Kumar L. Descriptors for characterization and evaluation of Ber (Ziziphus mauritiana) germplasm for evaluation and crop improvement. Fruits. 2022;72(2):1–10. [Google Scholar]
- 28.Kumar R, Dalve PD, Palande AL, Choudhary SM. Multivariate diversity analysis of tamarind (Tamarindus indica L.) genotypes arid condition of Western Maharashtra. Indian J Ecol. 2023;50(3):700–5. [Google Scholar]
- 29.Kuru P. Tamarindus indica and its health related effects. Asian Pac J Trop Bio Med. 2014;4(9):676–81. [Google Scholar]
- 30.Mahalanobis PC. (2018). On the generalized distance in statistics. Sankhyā: The Indian Journal of Statistics, Series A (2008-), 80, S1-S7.
- 31.Mayavel A, Muthuraj K, Nagarajan B, Prabhu R. Genetic variability studies in selected clones of red tamarind (Tamarindus indica var rhodocrpha) for yield and quality traits. Indian J Pure Appl Bio Sci. 2018a;6(4):174–80. [Google Scholar]
- 32.Mayavel A, Nagarajan B, Muthuraj K, Nicodemus A, Prabhu R. Correlation and path coefficient analysis of selected red tamarind (Tamarindus indica var rhodocarpha) genetic resources. Int J Curr Microbiol Appl Sci. 2018b;7(04):794–802. [Google Scholar]
- 33.Mayavel A, Vikashini B, Bhuvanam S, Shanthi A, Kamalakannan R, Kim KW, Kang KS. RAPD polymorphism and genetic distance among phenotypic variants of Tamarindus indica. J Soc Sci. 2020;109(4):421–8. 10.14578/jkfs.2020.109.4.421. [Google Scholar]
- 34.Meena SZ, Rahman MA, Bagga P, Mujahid M. Hepatoprotective activity of Tamarindus indica Linn stem bark ethanolic extract against hepatic damage induced by co-administration of antitubercular drugs Isoniazid and rifampicin in Sprague Dawley rats. J Basic Clin Physiol Pharma Col. 2018;30(1):131–7. [DOI] [PubMed] [Google Scholar]
- 35.Mendiburu Fde. 2023. Agricolae: Statistical procedures for agricultural research (Version 1.3-7) [R package]. Retrieved from https://cran.r-project.org/web/packages/agricolae/index.html
- 36.Menon JS, Asna AC, Menon MV, Pooja A, Gopinath PP, Singh AK. In situ characterization of tamarind (Tamarindus indica L.) fruit and spotting sweet tamarind types in Palakkad gap of Kerala. Plant Genet Res. 2023;21(2):166–73. 10.1017/S1479262123000588. [Google Scholar]
- 37.Mishra DS, Singh S, Singh AK, Yadav V. Genetic variability in acid lime accessions from central Gujarat. Indian J Hort. 2018;75(4):703–8. [Google Scholar]
- 38.Mishra DS, Singh A, Appa Rao VV, Yadav V, Berwal MK, Ravat P, Sarolia DK, Rane J, Tunc Y, Khadivi A. Comparative evaluation of red and white Aril genotypes of Manila tamarind for fruit physicochemical and bioactive attributes. Sci Rep. 2025;15:6865. 10.1038/s41598-025-90683-z. [DOI] [PMC free article] [PubMed] [Google Scholar]
- 39.Okello J, Okullo JBL, Eilu G, Nyeko P, Obua J. Mineral composition of Tamarindus indica LINN (tamarind) pulp and seeds from different agro-ecological zones of Uganda. Food Sci Nutr. 2017;55:959–66. 10.1002/fsn3.490. [DOI] [PMC free article] [PubMed] [Google Scholar]
- 40.Pareek OP, Awasthi OP. Genetic resources of tamarind. Indian J Plant Genet Resour. 2002;15(3):197–202. [Google Scholar]
- 41.Pooja GK, Adivappar N, Shivakumar BS, Lakshmana D, SharanabasappaKantharaj Y. Evaluation and character association studies on yield and quality parameters of tamarind genotypes. Int J Conserv Sci. 2018;6(4):582–5. [Google Scholar]
- 42.Purseglove JW. 1981. Tropical crops -Dicotyledons. The English language Book Society and Longman, Essen, U.K pp. 204–206.
- 43.Rajamanickam C. Genetic variability, correlation and path analysis in tamarind (Tamarindus indica L). J Spices Aromatic Crops. 2020;29(2):133–9. 10.25081/josac.2020.v29.i2.6860. [Google Scholar]
- 44.Rao CR. Advanced statistical methods in biometric research. Wiley; 1952.
- 45.Reddy AGK, Prasad TV, Shankar KS, Pushpanjali M, Jyothilakshmi N, Salini K, Babu RR, Singh VK, Yadagiri J. Morpho-biochemical characterization of tamarind (Tamarindus indica L). Legume Res. 2024;47(6):990. 10.18805/LR-5274. [Google Scholar]
- 46.Saran PL, Gajbhiye N, Patel RB, Choudhary R. Evaluation of elite accessions of Aegle Marmelos (L.) Correa for commercial yield and quality parameters under Indian conditions. Erwerbs-Obstbau. 2022;64(3):345–56. [Google Scholar]
- 47.Sharma DK, Aklade SA, Virdia HM. Genetic variability in tamarind (Tamarindus indica L.) from South Gujarat. Curr Hortic. 2015;3(2):43–6. [Google Scholar]
- 48.Shukla AK, Singh J. Studies on Physico-chemical evaluation of tamarind (Tamarindus indica L.) genotypes prevailing in Bastar region of Chhattisgarh on chemical characters. J Pharmacogn Phytochem. 2019;8(6):2349–55. [Google Scholar]
- 49.Singh TR, Nandini R. Genetic variability, character associaton and path analysis in the tamarind (Tamarindus indica L.) population of Nallur tamarind grove. SAARC J Agric. 2014;12(1):20–5. [Google Scholar]
- 50.Singh S, Singh AK. Studies on variability in tamarind (Tamarindus indica L). Prog Hortic. 2005;37(2):280–4. [Google Scholar]
- 51.Singh AK, Singh PP, Singh S, Bhargava R, Makwana P. Variability in morphological and physico-chemical traits of Aonla (Emblica officinalis genotypes collected from north-eastern region of India. Indian J Agric Sci. 2014;86(8):992–7. [Google Scholar]
- 52.Singh AK, Singh S, Saroj PL, Mishra DS, Singh PP, Singh RK. Aonla (Emblica officinalis) in India: A review of its improvement, production and diversified uses. Indian J Agric Sci. 2019;89(11):1773–81. [Google Scholar]
- 53.Singh S, Mishra DS, Singh AK. Tamarind (Chapter 16). Book: Tropical fruit crops theory to practical ([if gte mso 9]> 16.00 [endif][if gte mso 9] Normal 0 false false false EN-US X-NONE AR-SA [endif][if gte mso 9][endif][if gte mso 10][endif]Editors. Ghosh SN, Sharma RR). Chapter: 16 publisher. Delhi, India: Jaya Publishing House; 2021. pp. 610–31. https://www.researchgate.net/publication/351450947 [Google Scholar]
- 54.Singh AK, Pandey D, Kumar R, Yadav V, Yadav LP, Gangadhara K, Krishna H. Descriptors for characterization and evaluation of Bael (Aegle Marmelos (L.) Correa ex Roxb.) germplasm for utilization in crop improvement. Genet Resour Crop Evol. 2024. 10.1007/s10722-024-01903-w. [Google Scholar]
- 55.Srinivas PT, Govindarajulu B. Evaluation of tamarind clones for growth, yield and quality parameters. Andhra Agric J. 2017;64(2):417–20. [Google Scholar]
- 56.Sudjaroen Y, Haubner R, Würtele G, Hull WE, Erben G, Spiegelhalder B, Owen RW. Isolation and structure Elucidation of phenolic antioxidants from tamarind (Tamarindus indica L.) seeds and pericarp. Food Chem Toxicol. 2005;43(11):1673–82. [DOI] [PubMed] [Google Scholar]
- 57.Tsuda T, Watanabe M, Ohshima K, Yamamoto A, Kawakishi S, Osawa T. Antioxidative components isolated from the seed of tamarind (Tamarindus indica L). J Agric Food Chem. 1994;42(12):2671–4. [Google Scholar]
- 58.Wright S. Correlation and causation. J Agricultural Res. 1921;20(7):557. [Google Scholar]
- 59.Yadav LP, Koley TK, Tripathi A, Singh S. Antioxidant potentiality and mineral content of summer season leafy greens: comparison at mature and microgreen stages using chemometric. Agricultural Res. 2019;8:165–75. 10.1007/s40003-018-0378-7. [Google Scholar]
- 60.Yadav LP, Gangdhara K, Apparao VV. Evaluation of drumstick variety Thar Harsha under rainfed semi-arid conditions for growth, yield and quality along with antioxidant potentiality and nutrient content. South Afr J Bot. 2022;148:112–22. 10.1016/j.sajb.2022.04.005. [Google Scholar]
- 61.Yadav LP, Gangadhara K, Singh AK, Mishra DS, Yadav V, Rane J, Malhotra SK, Kaushik P, Jinger D, Meena NK, Apparao VV, Ram H. Genetic diversity, morphological and quality traits of Momordica dioica. Sci Rep. 2024a;14:30241. 10.1038/s41598-024-81828-7. [DOI] [PMC free article] [PubMed] [Google Scholar]
- 62.Yadav LP, Gangadhara K, Apparao VV, Yadav V, Mishra DS, Singh AK, Rane J, Kaushik P, Janani P, Kumar R, Verma AK, Kumar S, Malhotra SK, Sekhawat N. Genetic diversity, morphological traits, quality traits and antioxidants potentiality of Coccinia grandis germplasm under rainfed semi-arid region. Sci Rep. 2024b;14:868. 10.1038/s41598-023-49091-4. [DOI] [PMC free article] [PubMed] [Google Scholar]
Associated Data
This section collects any data citations, data availability statements, or supplementary materials included in this article.
Supplementary Materials
Data Availability Statement
The data that support the findings of this study are available from the co-corresponding authors upon reasonable request.