
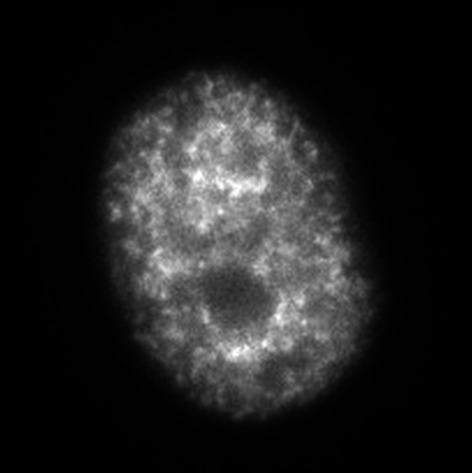
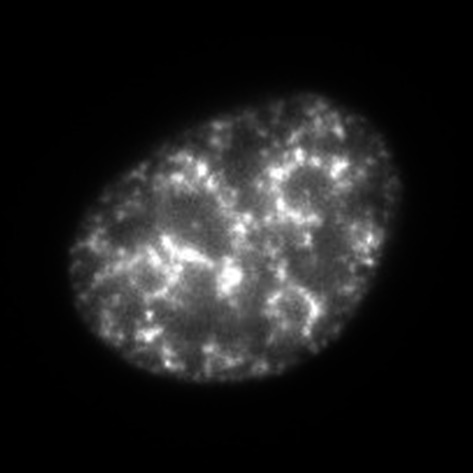
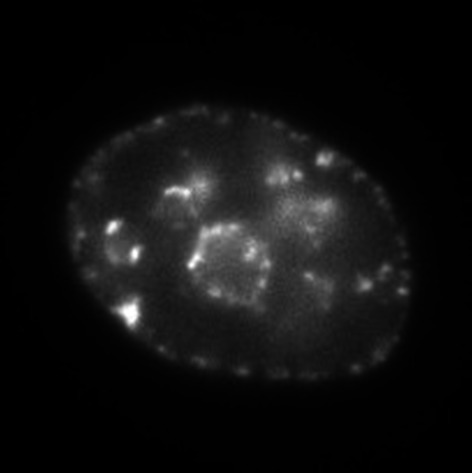
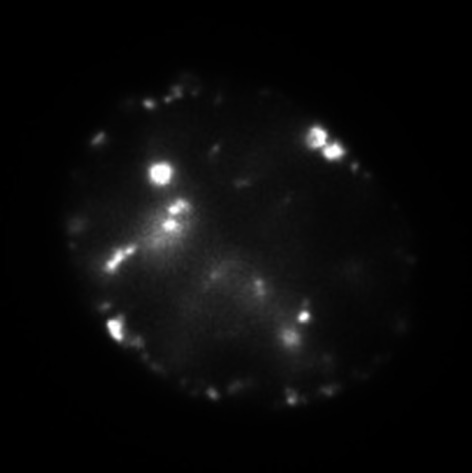
Table 1. Description of the labeling pattern in each class.
| Class | Replication timing* | Image† | Labeling pattern |
|---|---|---|---|
| IA | ~2 hours after the S-phase onset |
|
Throughout the nucleoplasm, excluded from the nuclear and nucleolar periphery |
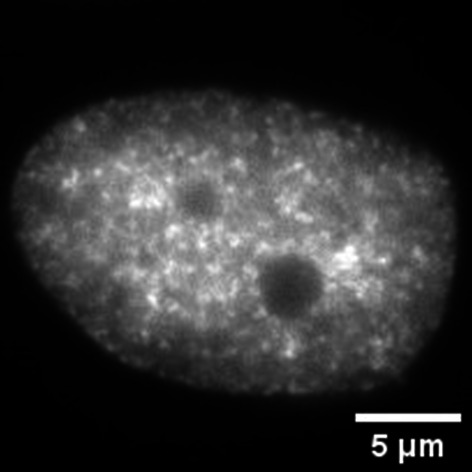
| IB | ~4 hours after the S-phase onset |
|
Throughout the nucleus, including the nuclear and nucleolar periphery |
| II | ~6 hours after the S-phase onset |
|
Nuclear and nucleolar periphery |
| III‡ | ~7 hours after the S-phase onset |
|
Large and discrete dot-like foci at the nucleoplasm and periphery |
| Ambiguous (Fig. 9 and fig. S13) | Appears in RIF1-depleted cells with aberrant replication timing |
|
Not categorized into any of the four classes, and distributed uniformly throughout the nucleus |
*Replication timing was determined by cell cycle–synchronized HeLa cells.
†Scale bar, 5 μm.
‡Class III H3.2-Halo also shows diffusive signals that are not colocalized with nascent DNA with EdU incorporation (fig. S5B).