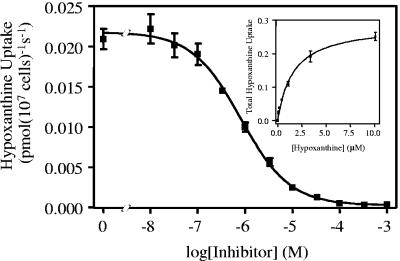
FIG. 2.
Transport of 0.1 μM [3H]hypoxanthine over 60 s was inhibited by the indicated concentrations of unlabeled hypoxanthine, with an IC50 of 0.81 μM for this experiment. The inset depicts the conversion of the hypoxanthine inhibition data to a Michaelis-Menten plot of total hypoxanthine uptake, with a Km of 1.6 μM and a Vmax of 0.29 pmol 107 cells−1 s−1 for this experiment, showing total hypoxanthine transport as opposed to [3H]hypoxanthine transport only.

